Topic
This guide details the summary report types available within NinjaOne and defines the specific data modules you can include to customize your reporting output.
If this is your first time working with reports, we recommend that you begin with NinjaOne Reporting: Getting Started.
Environment
NinjaOne Reporting
Description
Summary reports encapsulate key findings and highlight essential data about your organizations, providing a high-level overview of your chosen subject. NinjaOne makes it easy for you to tailor your report with templates and empowers you to customize the information you include.
All report types are available for organization reports. Some report types are not available for global reports. For a list of the report types available with global reports, refer to Report Section Overview within this article.
Select a topic to continue:
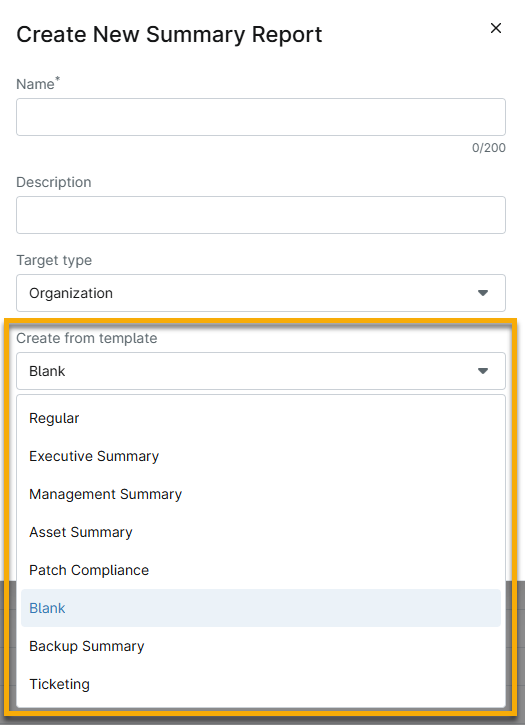
Report Template Type Overview
Report templates provide a structured starting point for targeted reporting. They automatically include category-specific data while excluding irrelevant details, improving clarity for the reader. These templates are fully customizable to fit your specific needs.
| Report Type | Description |
|---|---|
| Regular |
|
| Executive Summary |
|
| Management Summary |
|
| Asset Summary |
|
| Patch Compliance |
|
| Blank |
|
| Backup Summary |
|
| Ticketing |
|
Report Section Overview
Depending on the report type selected, different sections are available. These sections can be added or removed when editing a report by clicking the Customize button.
Data Table Sections
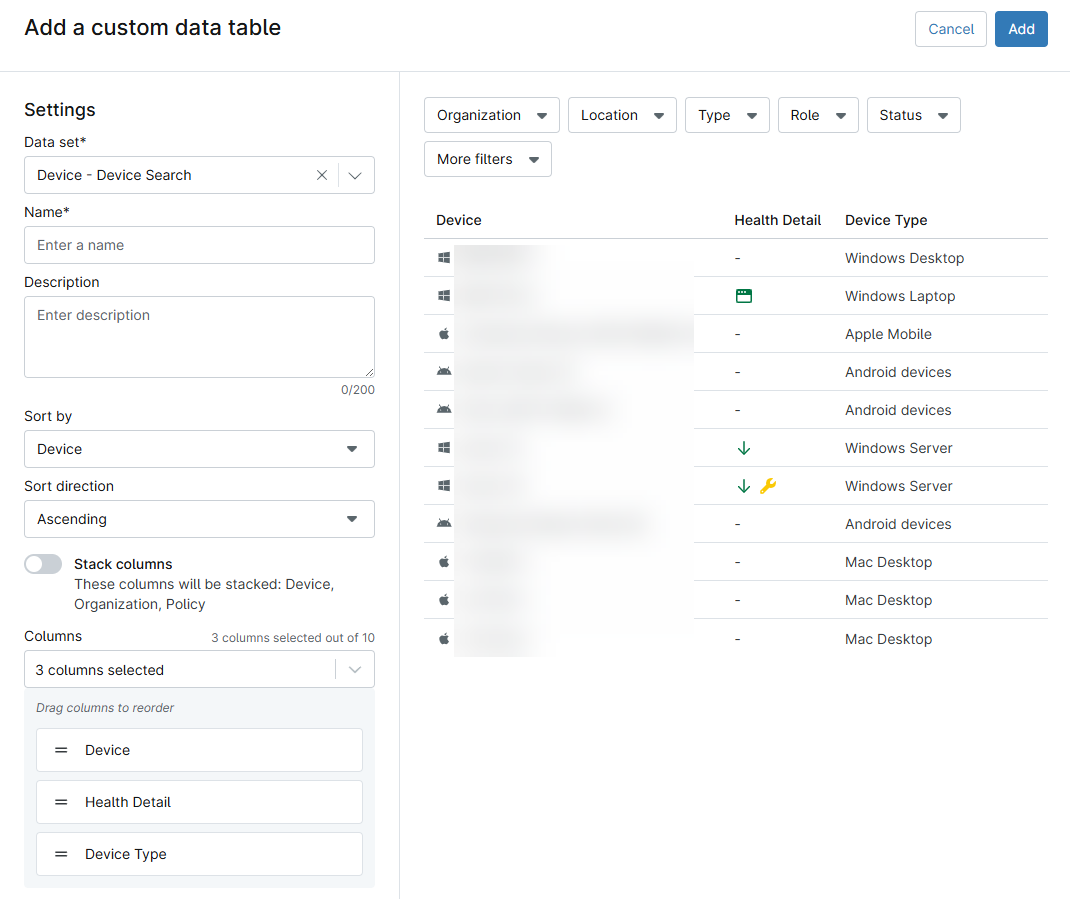
Custom Data Table
This section is available for the Organization and Global report types. Create a custom data table similar to the Devices search page in NinjaOne. You can add columns and sort to filter devices by specific criteria.
Regular Sections
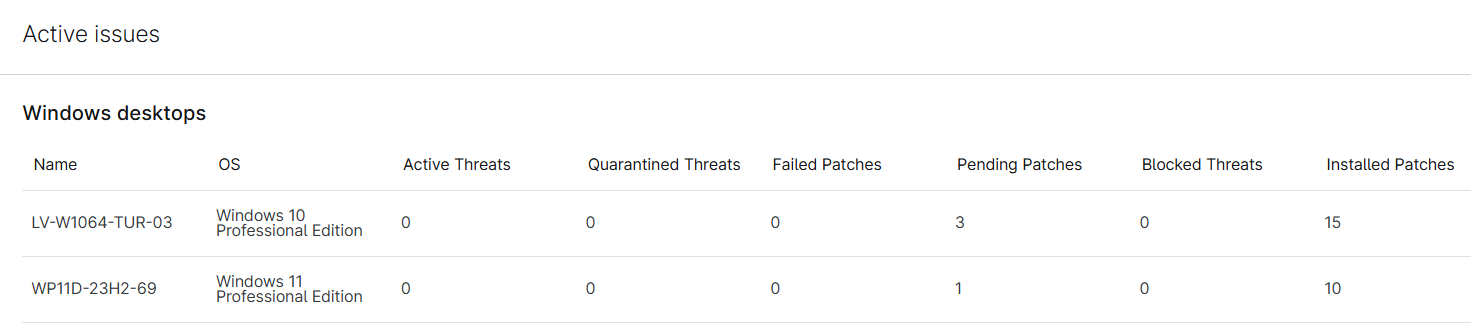
Active Issues
This section is available for the Organization report type and includes the following data for devices experiencing active issues:
- Device name
- Device operating system
- Active threats
- Quarantined threats
- Failed patches
- Pending patches
- Blocked threats
- Installed patches
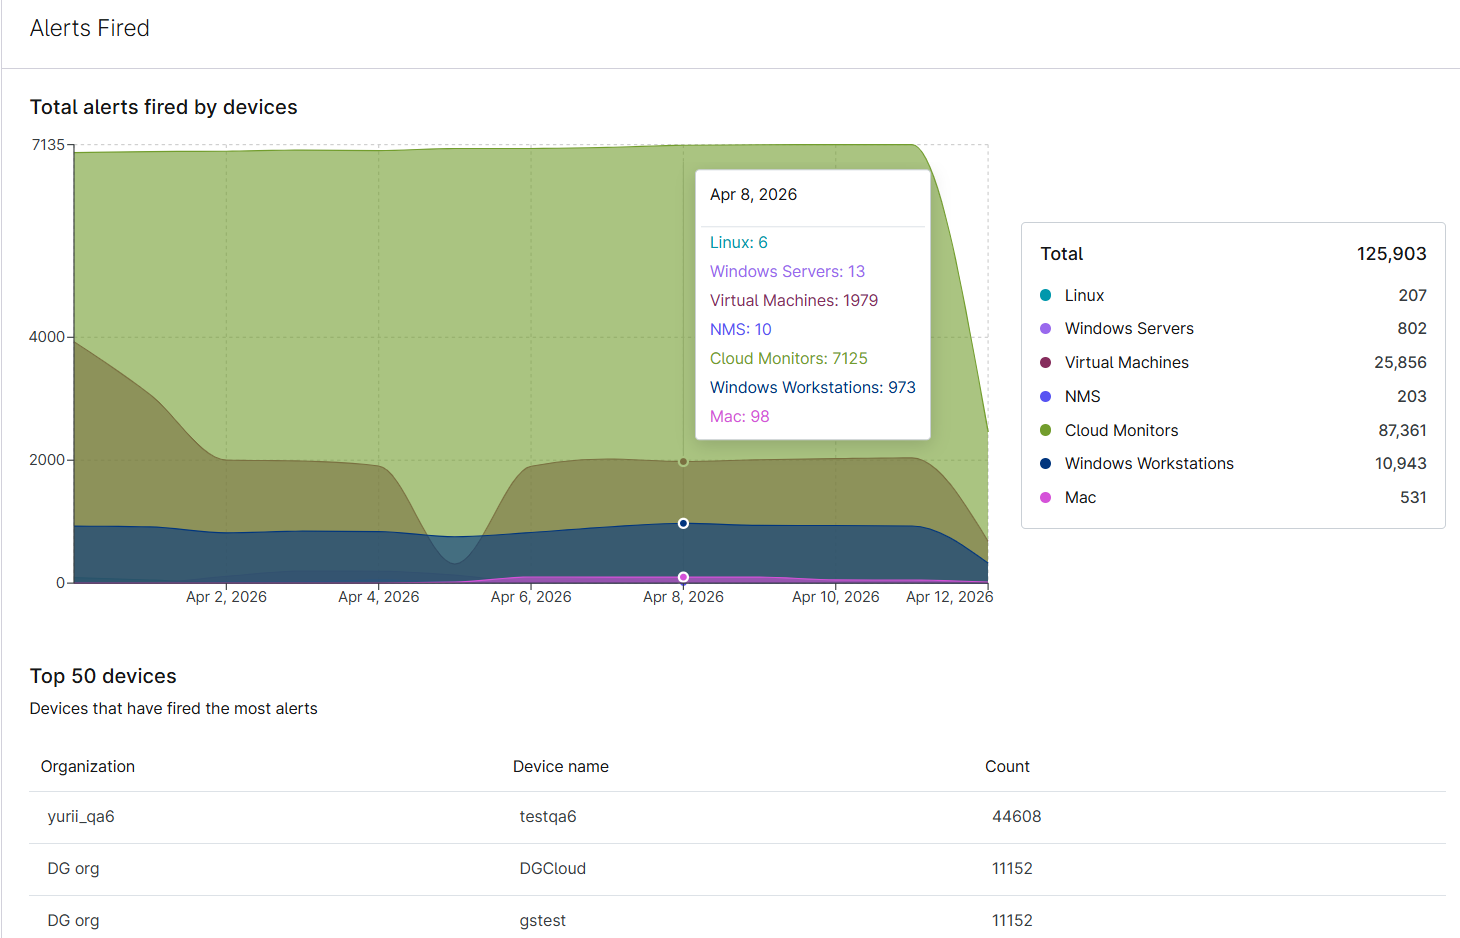
Alerts
This section is available for Global and Organization report types and includes the following data:
- Total alerts fired by devices
- Top 50 devices that have fired the most alerts
- Organization, device name, and count
Move your mouse cursor over the graph to view specifications for each day.
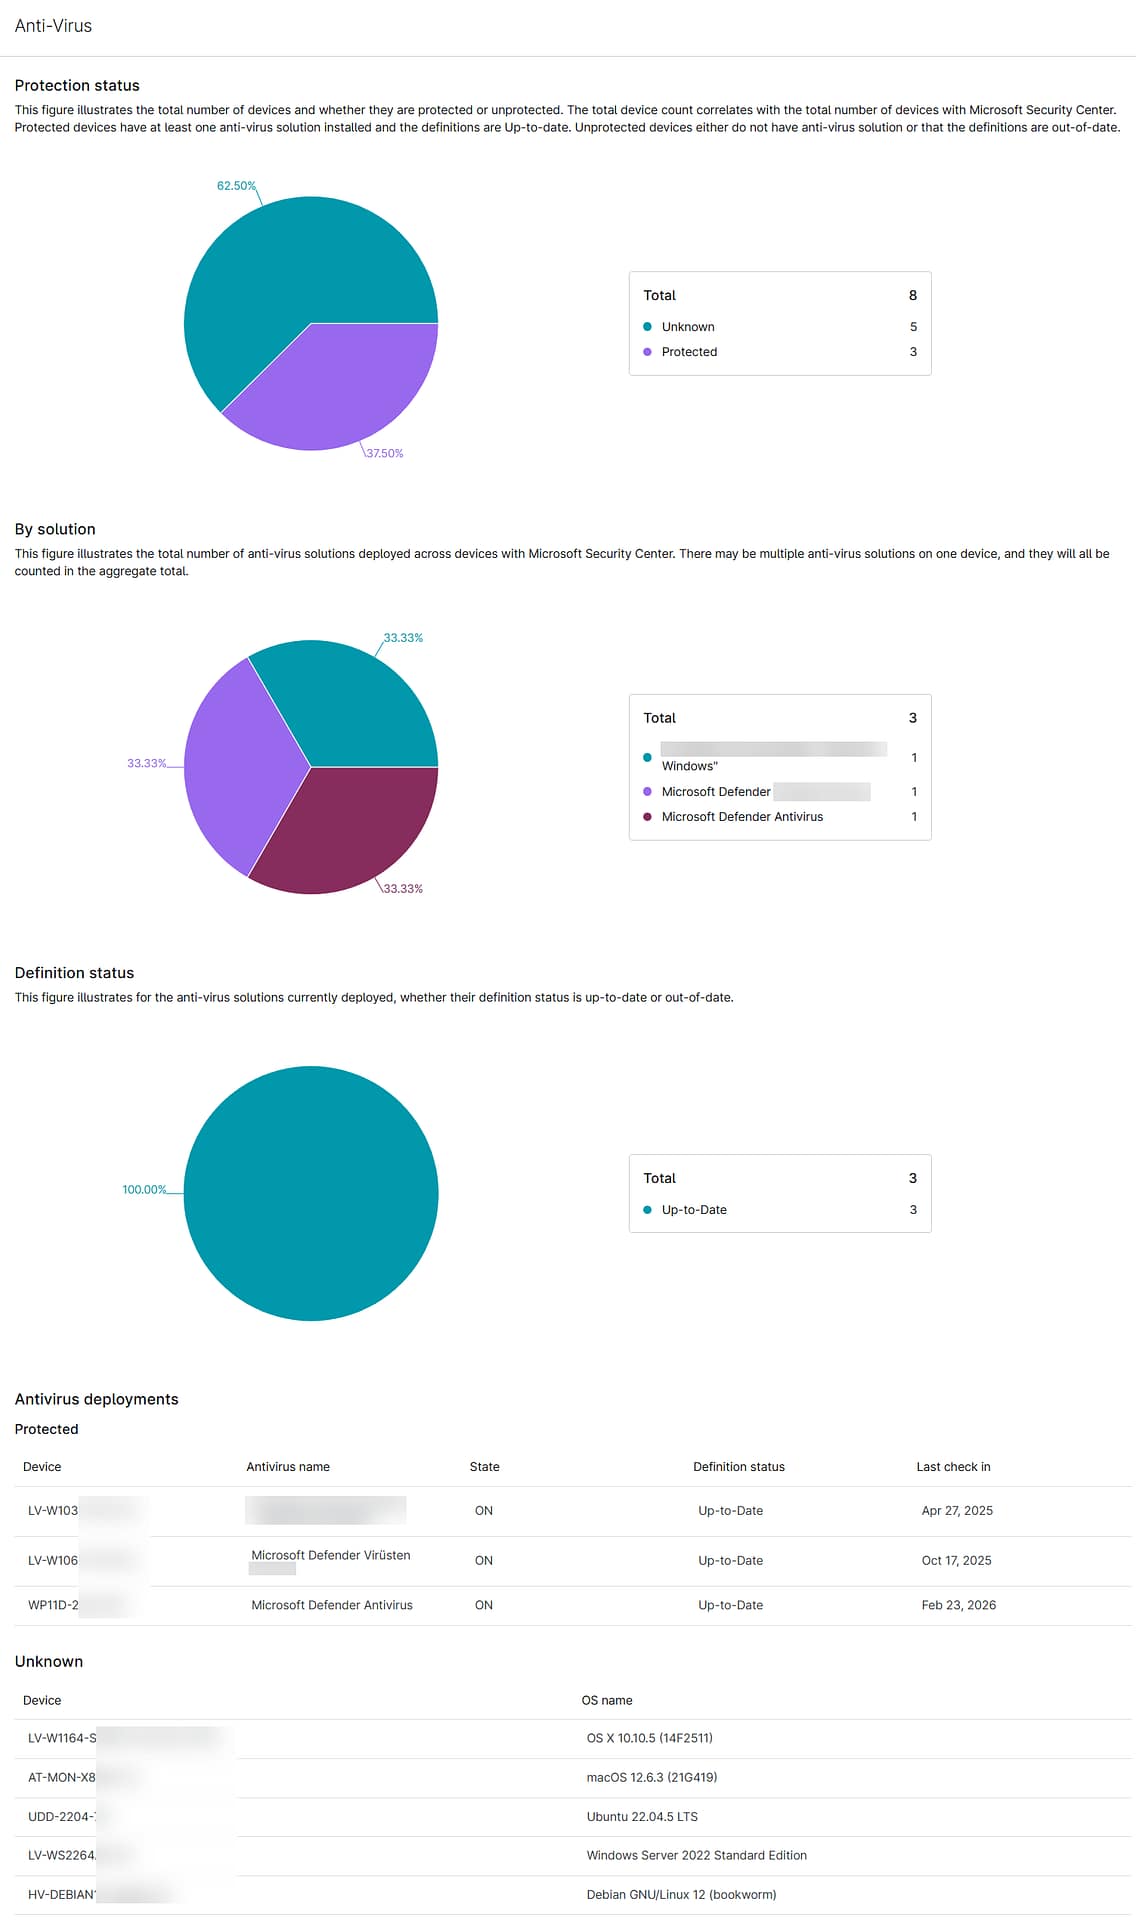
Antivirus
This section is available for the Organization report type and includes the following data for your antivirus (AV) software:
- Protection status: The total number of devices and whether they are protected or unprotected
- By solution: the total number of AV solutions deployed across devices with Microsoft Security Center
- Definition status: the AV solutions currently deployed
- Antivirus deployments: Unprotected, protected, and unknown
- Device name
- Antivirus name
- Last check in
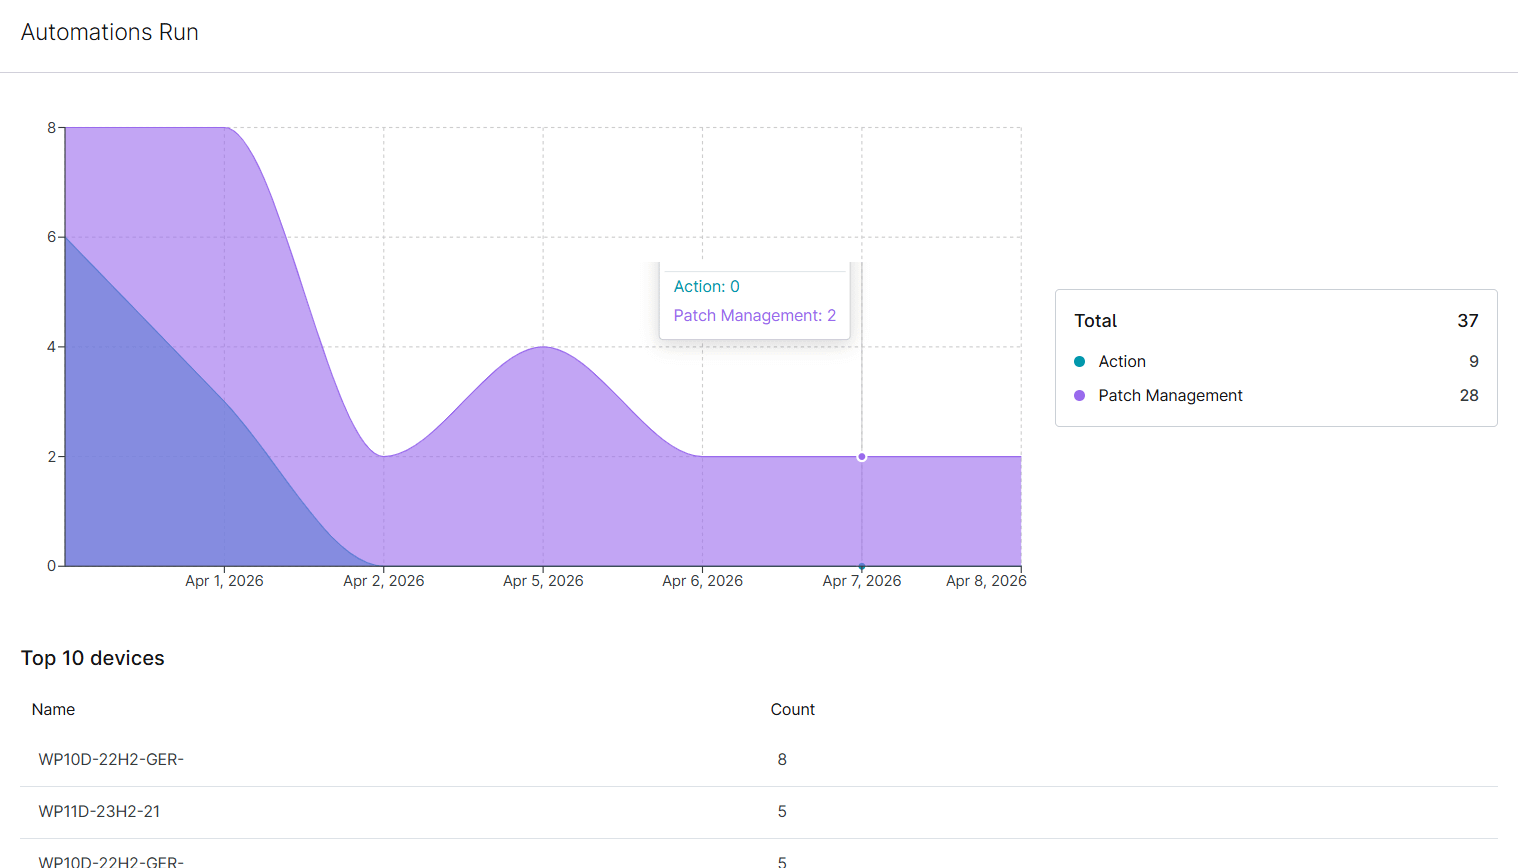
Automation
This section is available for the Organization report type and shows total automations run, and the top 10 devices by their name and automation count.
Move your mouse cursor over the graph to see counts for each day listed.
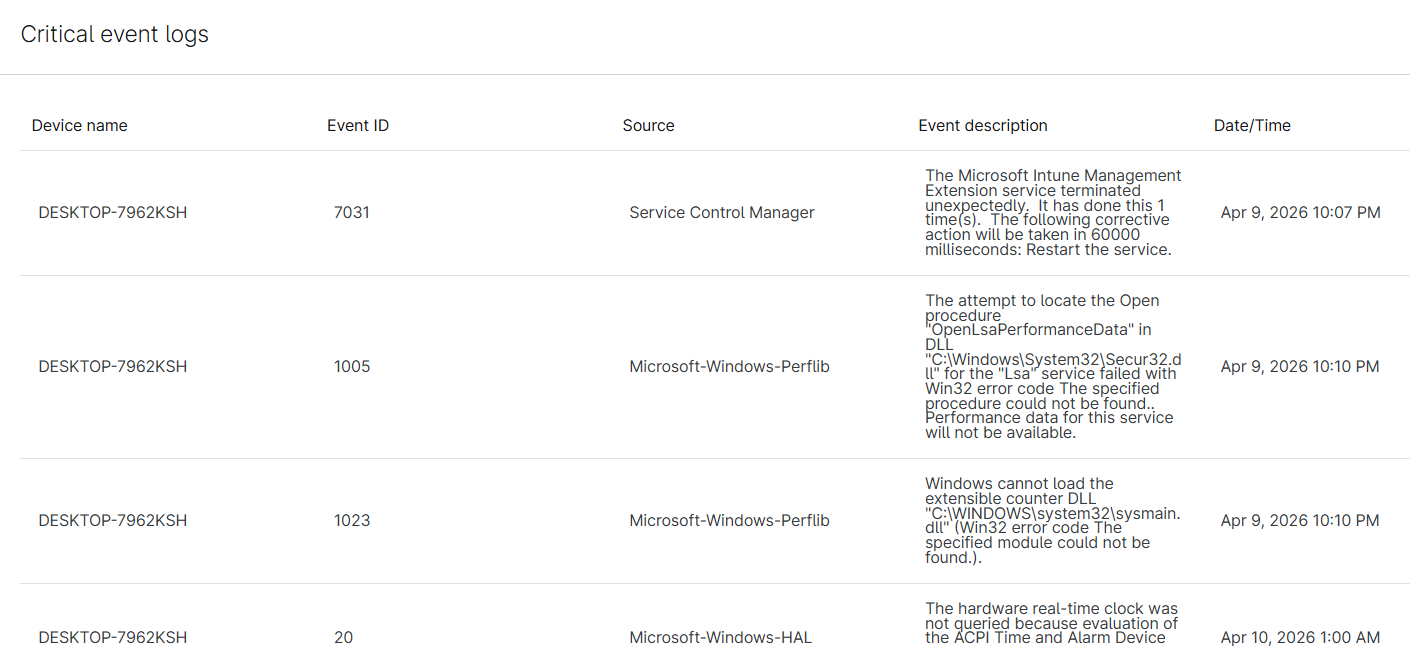
Critical Event Logs
This section is available for the Organization report type and includes the following data for critical event logs:
- Device name
- Event ID
- Source
- Event description
- Date and time the event occurred
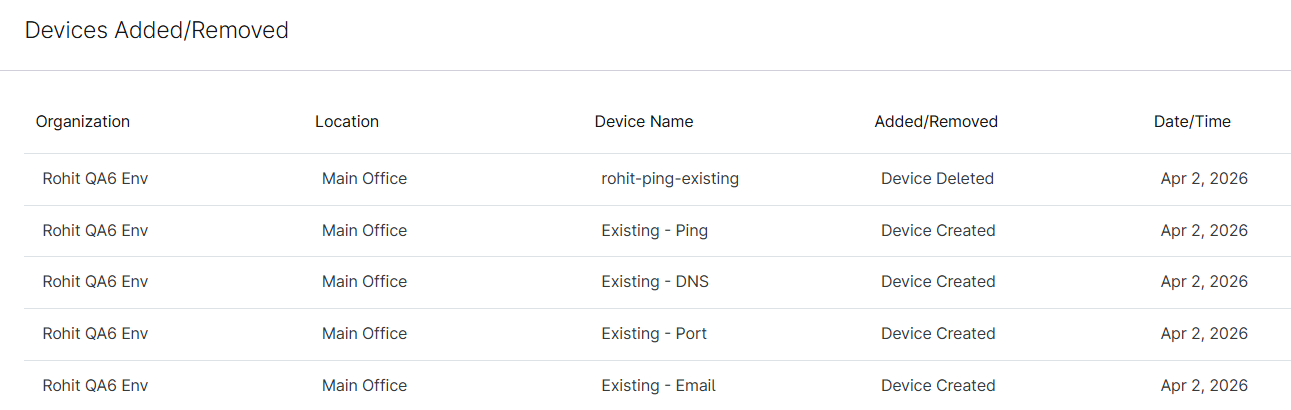
Devices Added/Removed
This section is available for Global and Organization report types and reports the following data for all devices that were added or removed for the selected time period:
- Organization
- Location
- Device name
- Added or removed
- Date and time device was added or removed
Disk Encryption
This section is available for the Organization report type and includes the following data for disk encryption enablement:
- Location
- Device name
- Device type
- Volume
- Trusted Platform Model (TPM) status
- TPM version
- Disk encryption status
NetFlow
This section is available for the Organization report type and includes the following data for NetFlow traffic:
- Firewalls by application, domain, and endpoint
- Name
- Protocol
- Port
- Total traffic
- Percentage
- Conversations
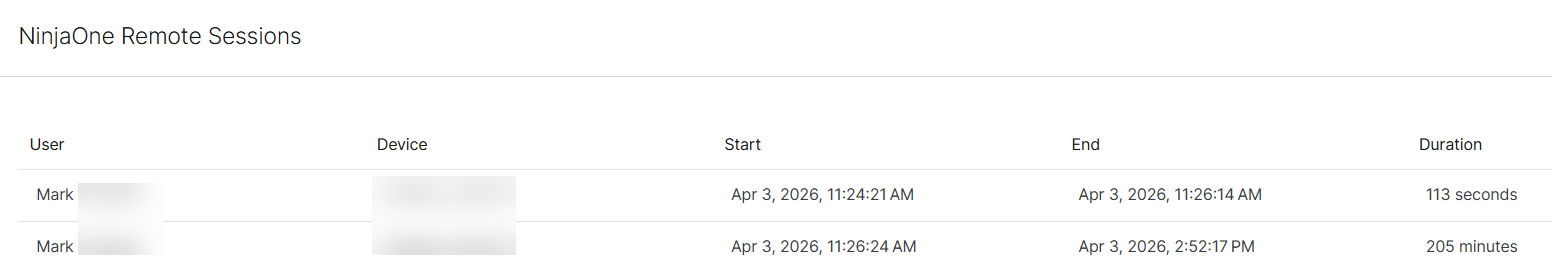
NinjaOne Remote
This section is available for the Organization report type and includes the following data for NinjaOne Remote sessions:
- Total sessions
- User
- Device
- Start
- End
- Duration
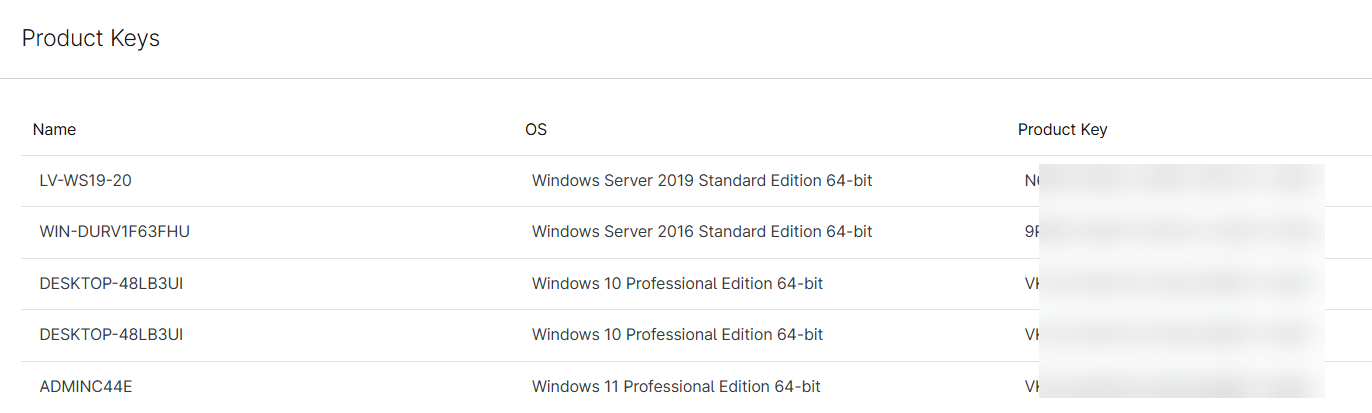
OS Product Keys
This section is available for the Organization report type and includes the following data for product keys:
- Name
- Operating system
- Product key
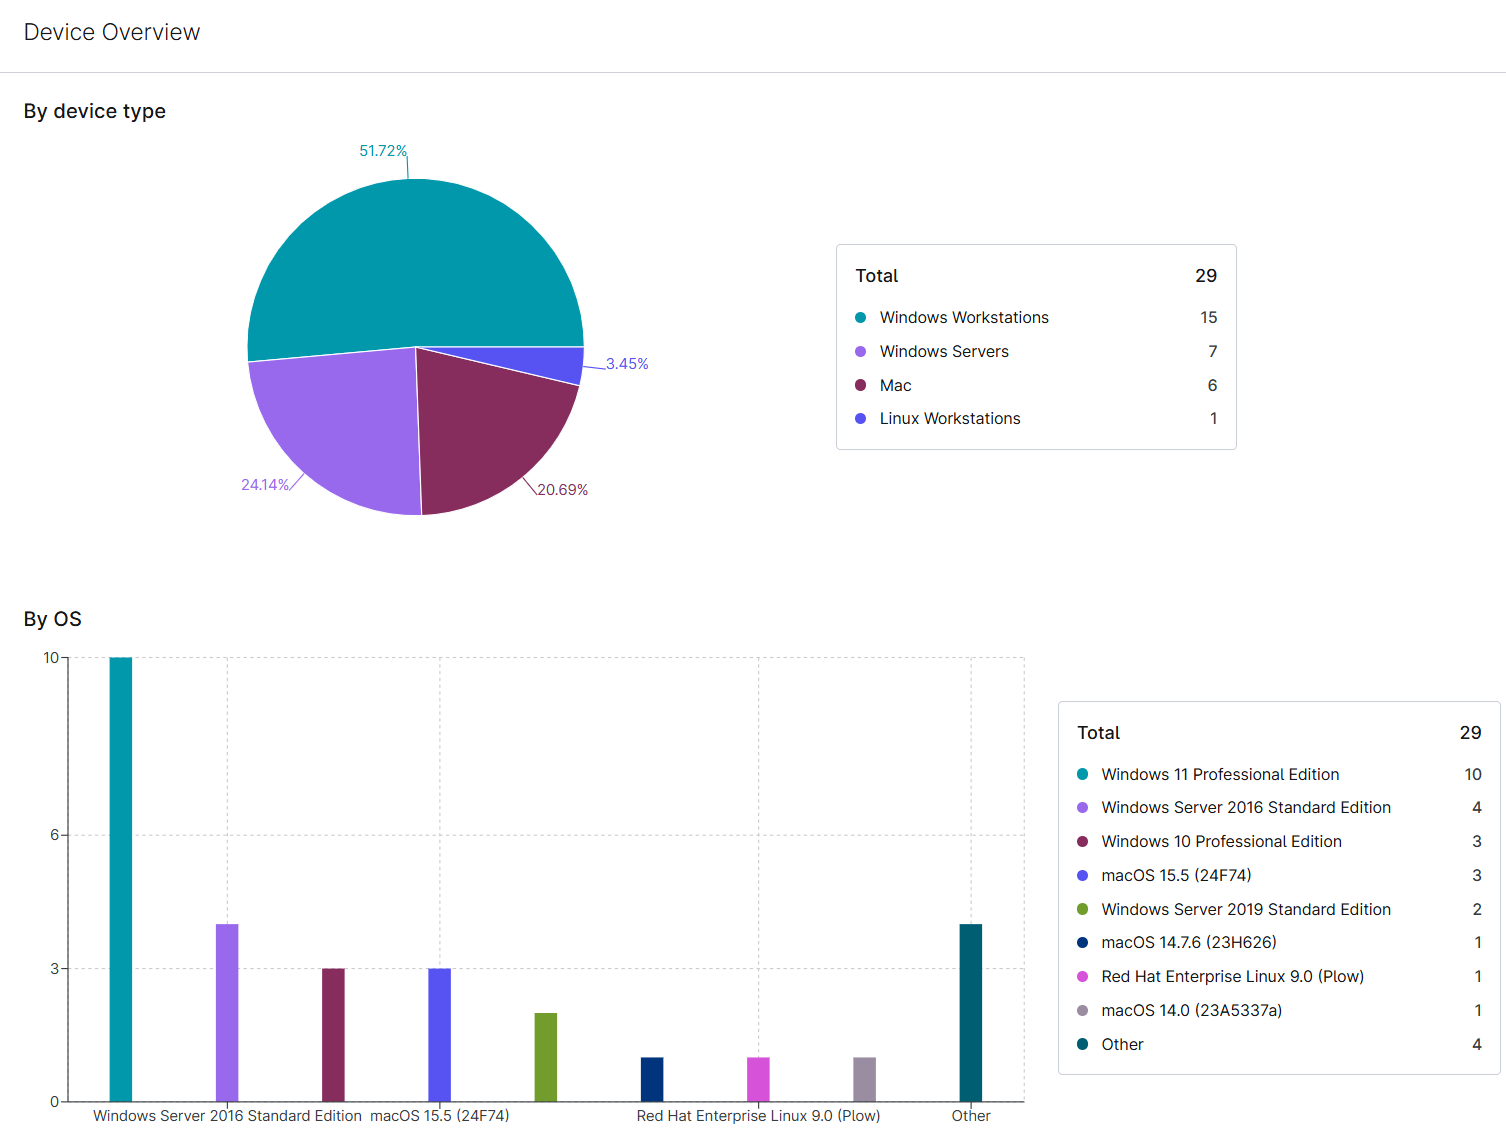
Overview
This section is available for the Organization report type and includes the following data for device overview:
- Total by device type
- Total by OS type
Remote Support Sessions
This section is available for the Global report type and provides the following data:
- Support folder
- Device
- User
- Connection tool
- Start
- End
- Duration
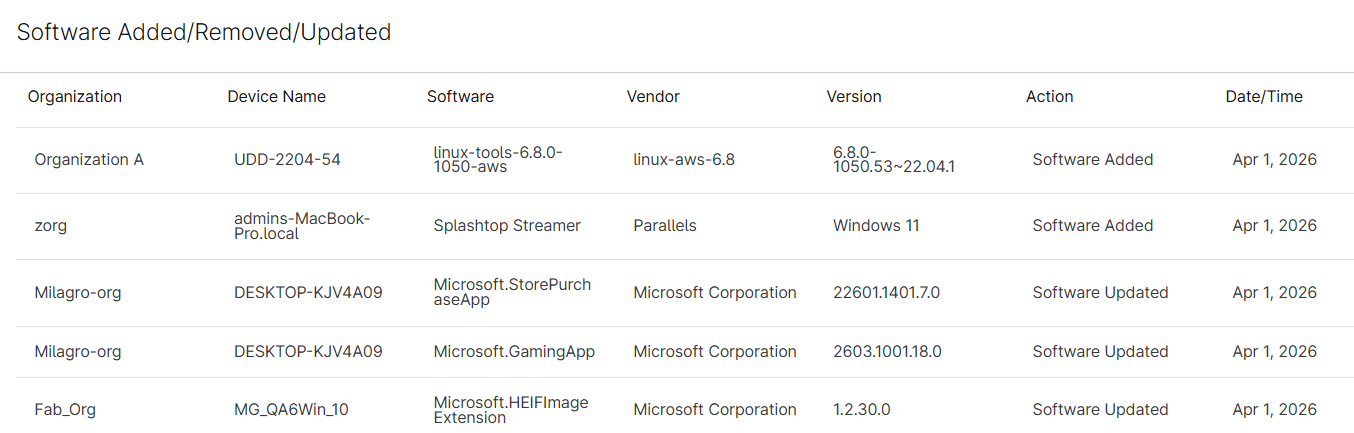
Software Added/Removed/Updated
This section is available for Global and Organization report types and reports the following data for all software that was added, removed, or updated during the selected time period:
- Organization
- Device name
- Software
- Vendor
- Version
- Action
- Date and time software was added or removed
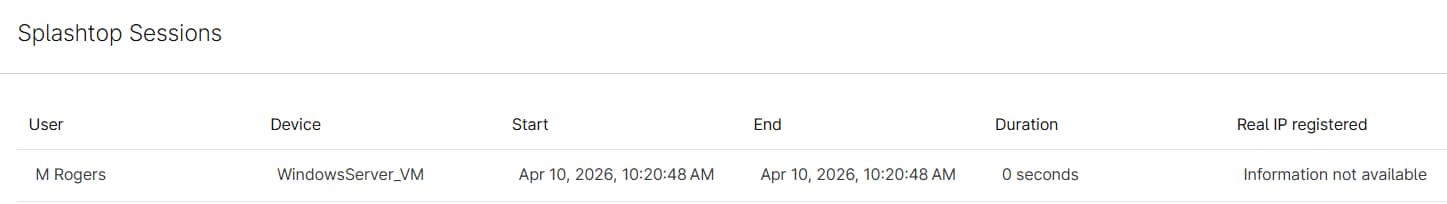
Splashtop
This section is available for the Organization report type and includes the following data for Splashtop sessions:
- User
- Device
- Start
- End
- Duration
- Real IP registered
Task History
This section is available for the Organization report type and includes the following data for scheduled task history:
- Task name
- Start date
- Final date
- Targets count
- Nodes failed

Executive Summary Sections
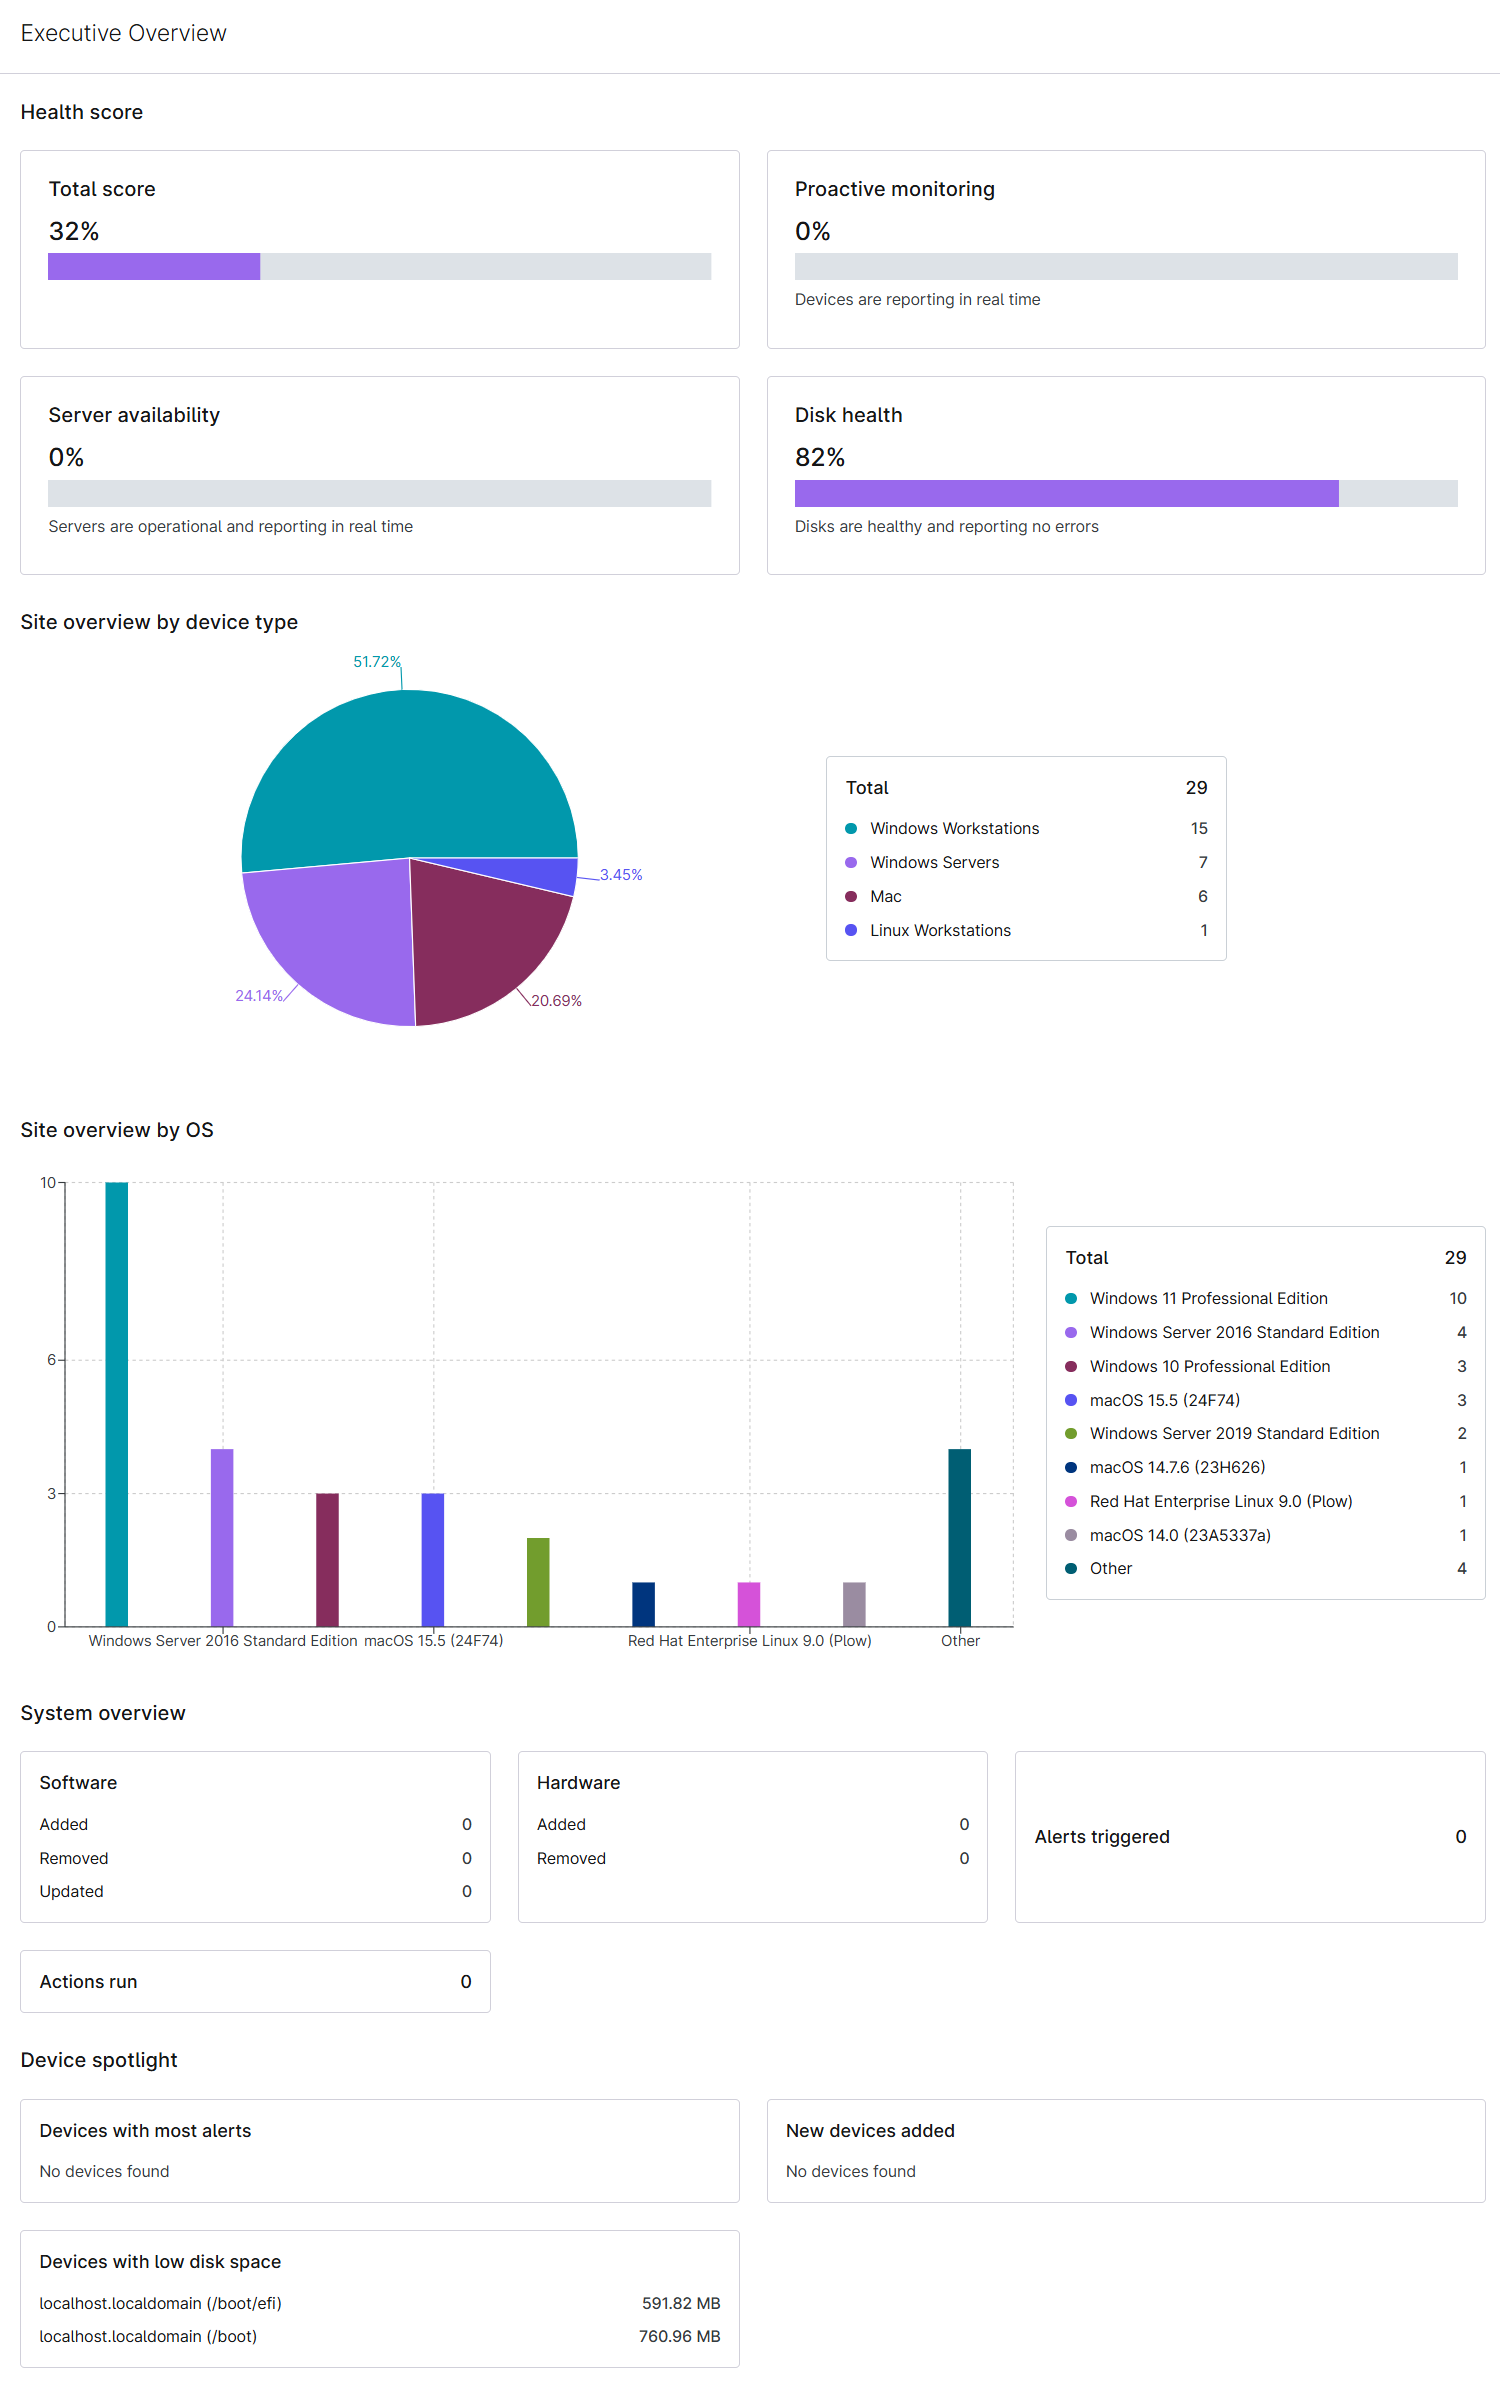
Executive Overview
This section is available for the Organization report type and includes the following data:
- Health score
- Total score
- Proactive monitoring
- Server availability
- Disk health
- Site overview by device type
- Site overview by OS
- System overview
- Software
- Hardware
- Alerts triggered
- Action run
- Device spotlight
- Devices with the most alerts
- New devices added
- Devices with low disk space
Executive Summary
This section is available for the Organization report type and includes the following data:
- Health score
- Total score
- Proactive monitoring
- Disk health
- Antivirus protection
- Site overview by device type
- Site overview by OS
- System overview
- Antivirus
- Software
- Hardware
- Alerts triggered
- Action run
- Device spotlight
- Devices with the most alerts
- New devices added
- Devices that had infections
- Devices with low disk space
Management Summary Sections
Management Summary
This section is available for the Organization report type and includes the following data:
- Overall health
- Patch coverage
- Antivirus protection
- Top volumes by disk usage
- Top device types by count
- Top device OS by count
Asset Summary Sections
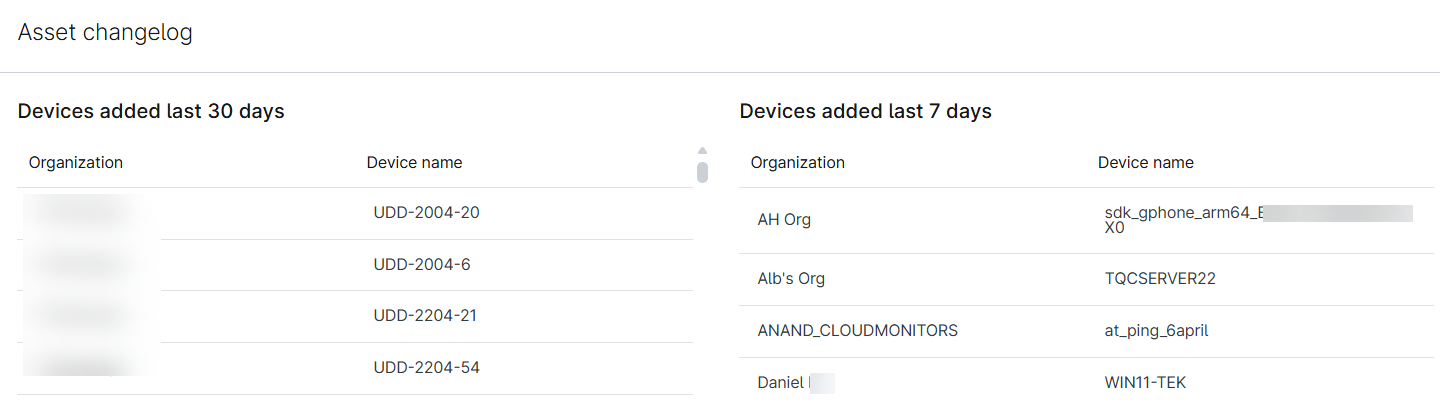
Asset Changelog
This section is available for Global and Organization report types and reports the following data:
- Devices added last 30 days
- Devices added last 7 days
Device Notes
This section is available for Global and Organization report types and reports the following data
- Device name
- Excerpt of the note
- Date that the note was created

Device Spread
This section is available for the Organization report type and shows a pie graph of all devices for a specific organization.

Devices by OS
This section is available for the Organization report type and includes the total number of devices for Windows, macOS, and Linux.
Move your mouse cursor over the bar graph to view details.
Devices Details
This section is available for the Organization report type and includes the following data:
- Device name
- Vendor or model
- Serial number
- OS
- Install date
- Processors
- Memory
- Disk drives' size, status, and type
- IPs, DNS, or gateway
- Domain
- BIOS version
- BIOS release date
- Last login
- Last boot time
- Uptime
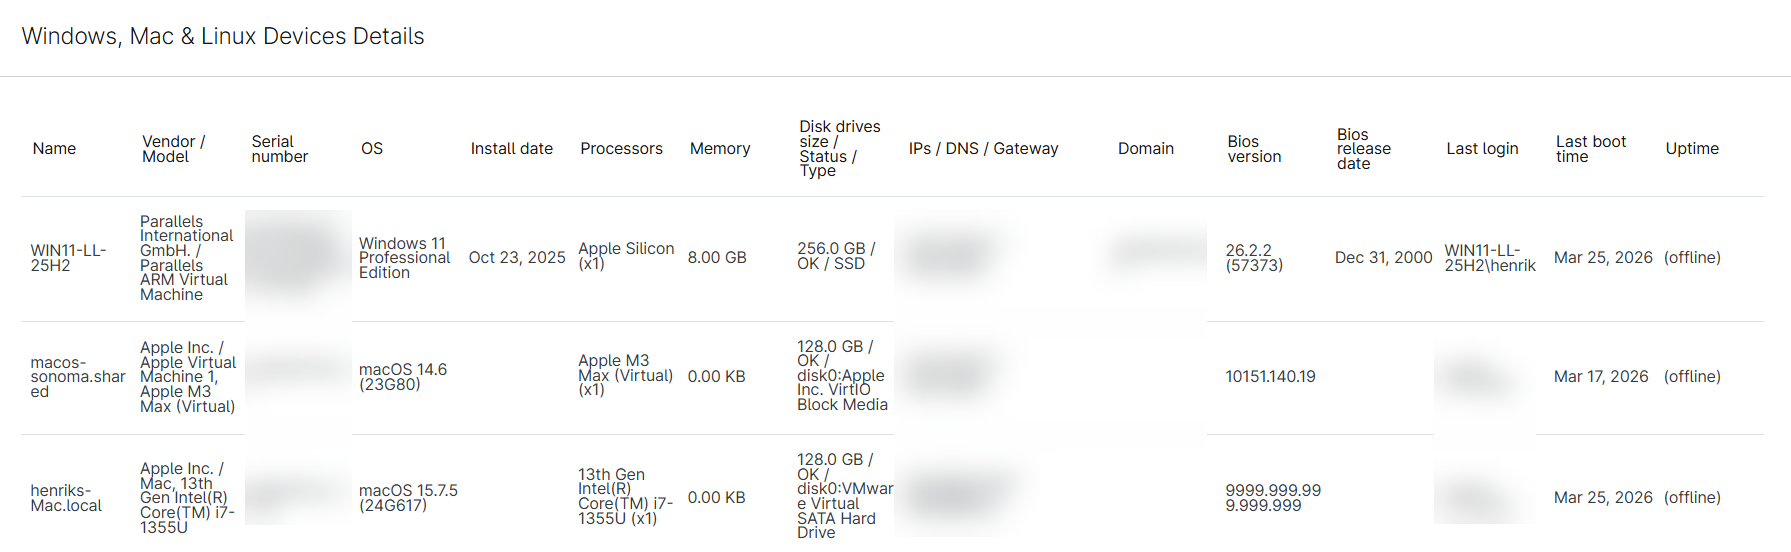
Devices Hard Drive Details
This section is available for the Organization report type and includes the following data:
- Device list by hard drive spread
- Device list with disk volume details.
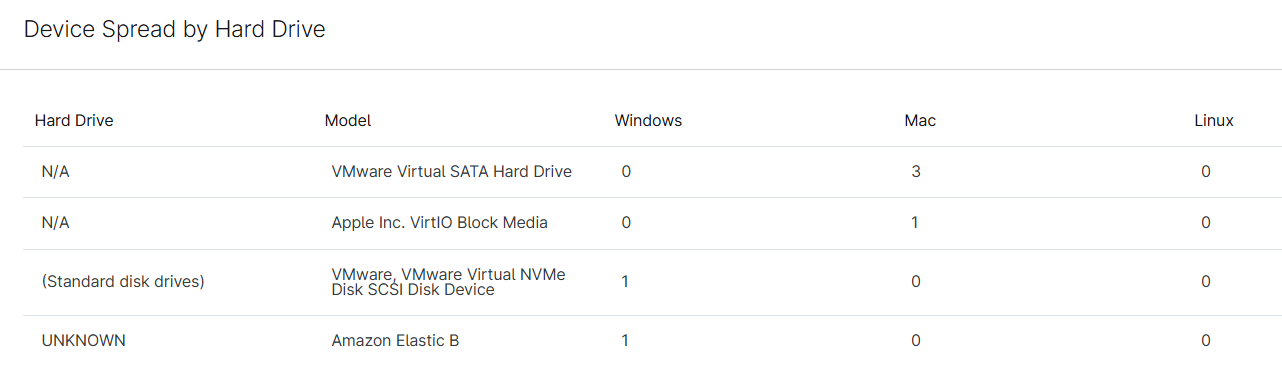
Devices by Hard Drive
This section is available for the Organization report type and includes the following data:
- Device List by Hard Drive Spread: Generates a table that includes device name, serial number, vendor, model, type, and status
- Device List with Disk Volume Details: Generates a table that includes device name, drive letter, drive type, file system, capacity, used space, and free percentage
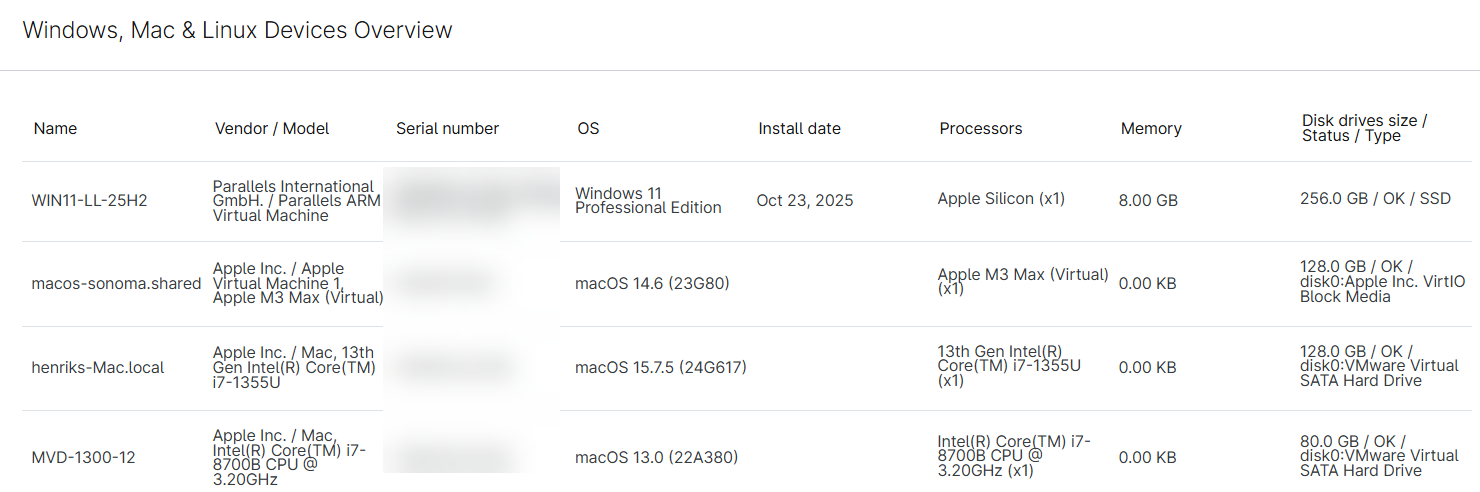
Devices Overview
This section is available for the Organization report type and includes the following data:
- Device name
- Vendor or model
- Serial number
- OS
- Install date
- Processors
- Memory
- Disk drives' size, status, and type
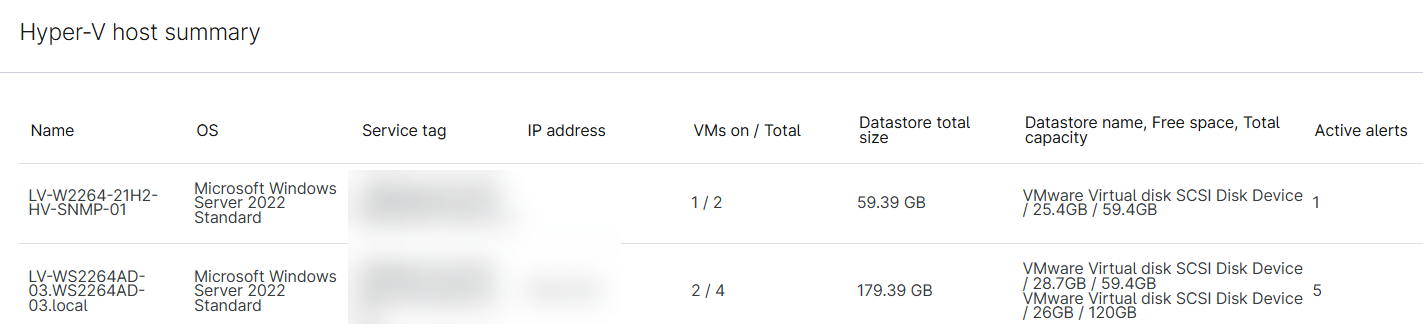
Hyper-V Host Summary
This section is available for the Organization report type and includes the following data:
- Device name
- OS
- Service tag
- IP address
- Total VMs on
- Datastore total size
- Datastore name, free space, and total capacity
- Active alerts
Hyper-V Virtual Machine Summary
This section is available for the Organization report type and includes the following data:
- Host name
- OS, and IP address
- vCPUs
- Memory
- Storage used versus total
- Status
- Tools installed
- Snapshot exists
- Active alerts
- Guest tools

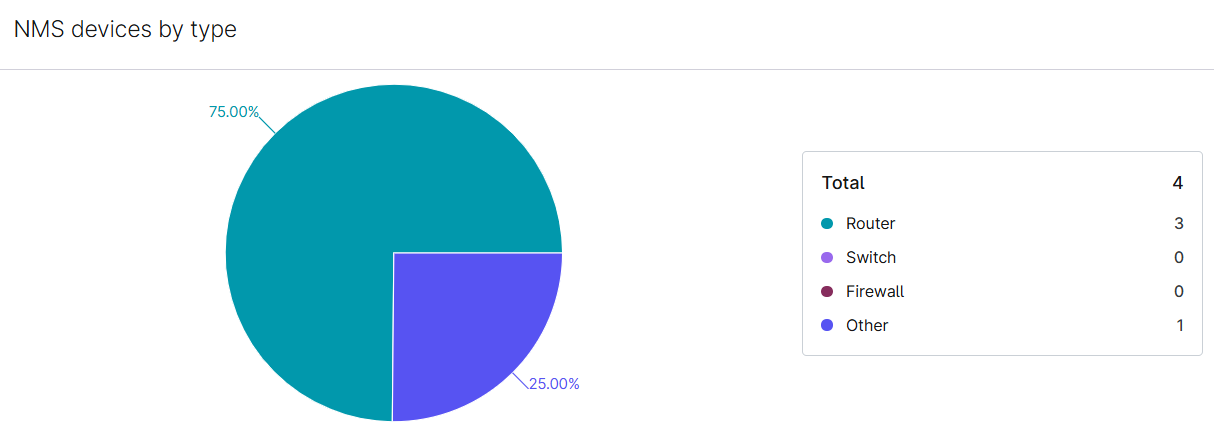
NMS Devices by Type
This section is available for the Organization report type and shows all devices by type (router, switch, firewall, or other) across an organization.
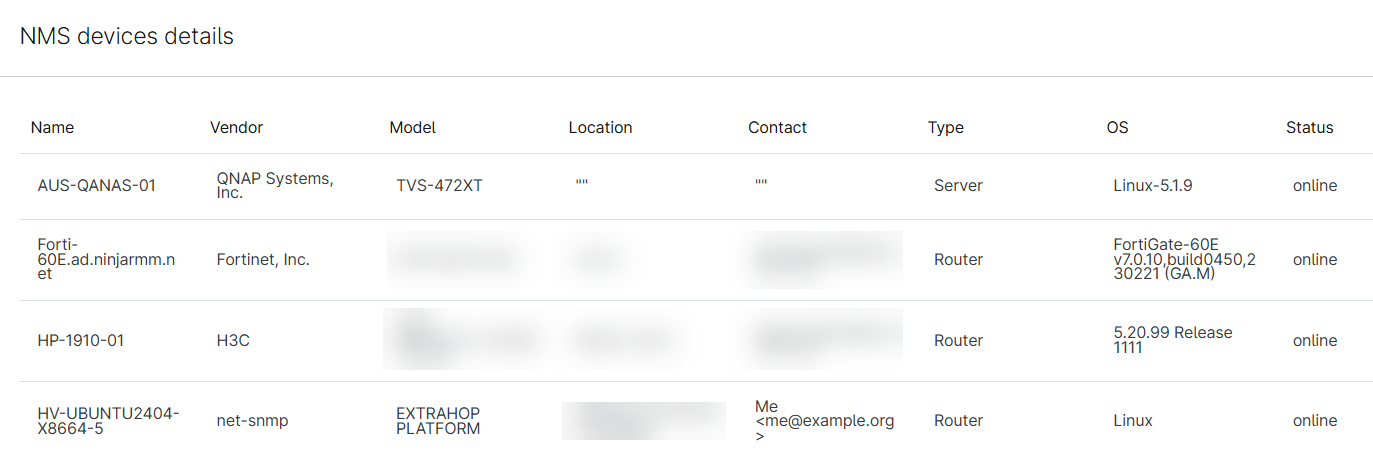
NMS Devices Details
This section is available for the Organization report type and includes the following data:
- Device name
- Vendor
- Model
- Location
- Contact
- Type
- OS
- Status
NMS Devices Spread
This section is available for the Organization report type and shows a pie graph of all NMS devices for a specific organization (Cisco, Dell, HP, or other).

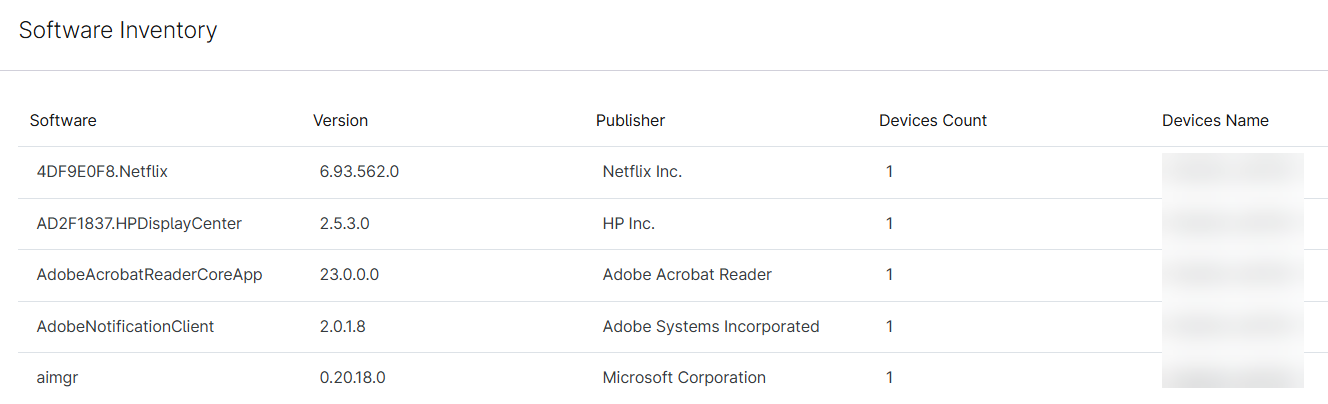
Software Inventory
This section is available for the Organization report type and includes the following data:
- Software name
- Version
- Publisher
- Device count and device name
VMware Host Summary
This section is available for the Organization and Global report types and includes the following data:
- Host name
- OS
- Service tag
- IP address
- VM on versus the total number of VMs
- Datastore total size
- Datastore name, free space, and total capacity
- Active alerts
VMware Virtual Machine Summary
This section is available for the Organization report type and includes the following data:
- Host name
- OS, and IP address
- vCPUs
- Memory
- Storage used versus total
- Status
- Tools installed
- Snapshot exists
- Active alerts
- Guest tools
Patch Compliance Sections
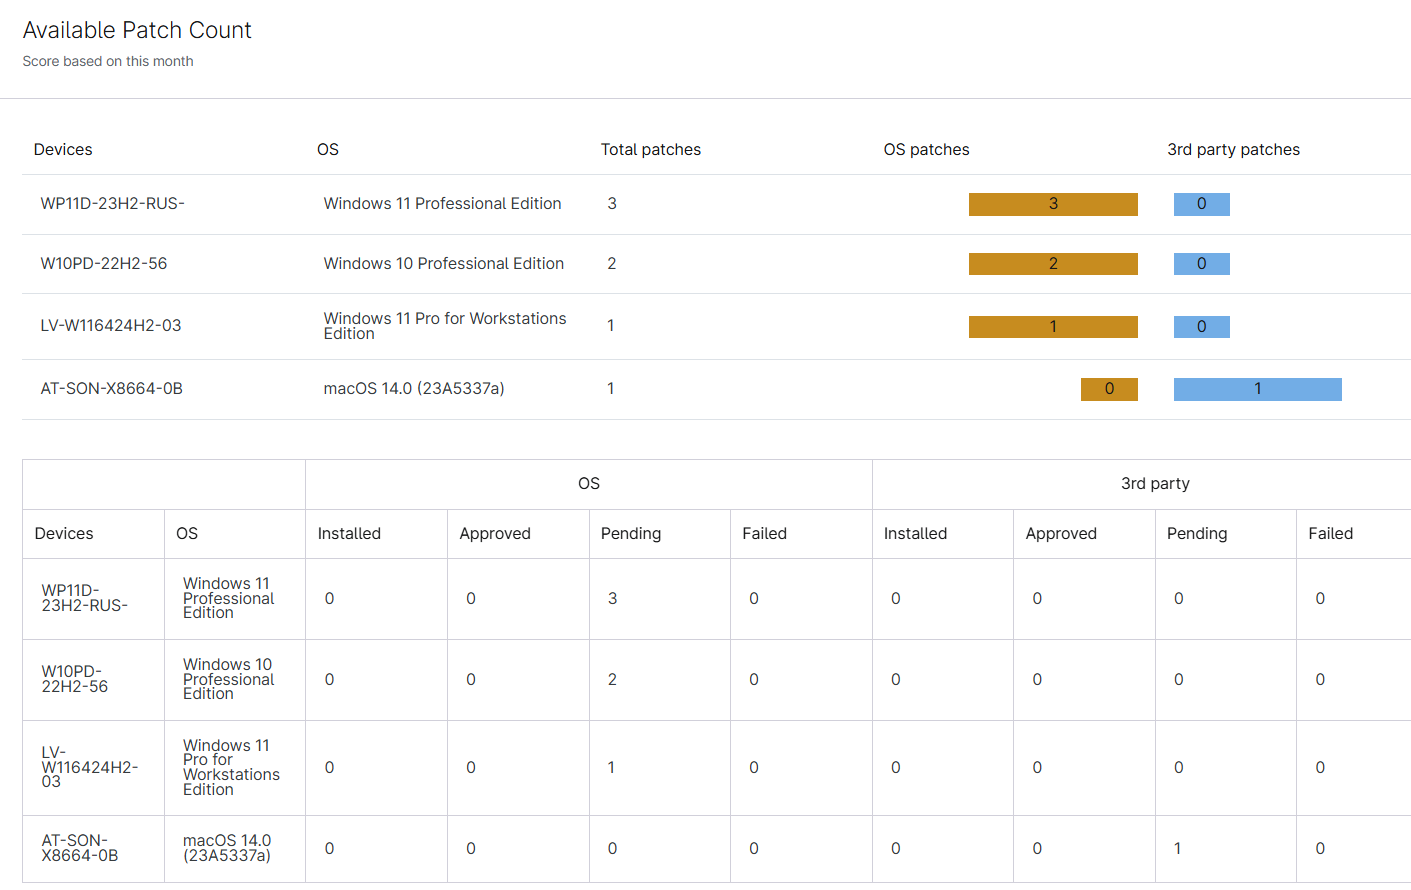
Available Patch Count
This section is available for the Organization and Global report types and shows scores based on current data, including the following information:
- Devices
- OS
- Total patches
- OS patches (installed, approved, pending, and failed)
- Third-party patches (installed, approved, pending, and failed)
OS Patch Enablement
This section is available for the Organization and Global report types and shows the percentage of devices with patch management policy activated, including data for deactivated patch management policies.
Patch Compliance
This section is available for the Organization and Global report types and indicates when the score is equal to the installed or total number of patches, including the following information:
- Patch status score
- Installed
- Approved
- Pending
- Failed
Patch Device Overview
This section is available for the Organization and Global report types and shows device patch percentage installed versus total patches between workstations and servers. Additionally, it provides the following information:
- Device name
- OS
- Installed, approved, pending, or failed number of patches
- Last scan date
- Last scan result
- Reboot pending
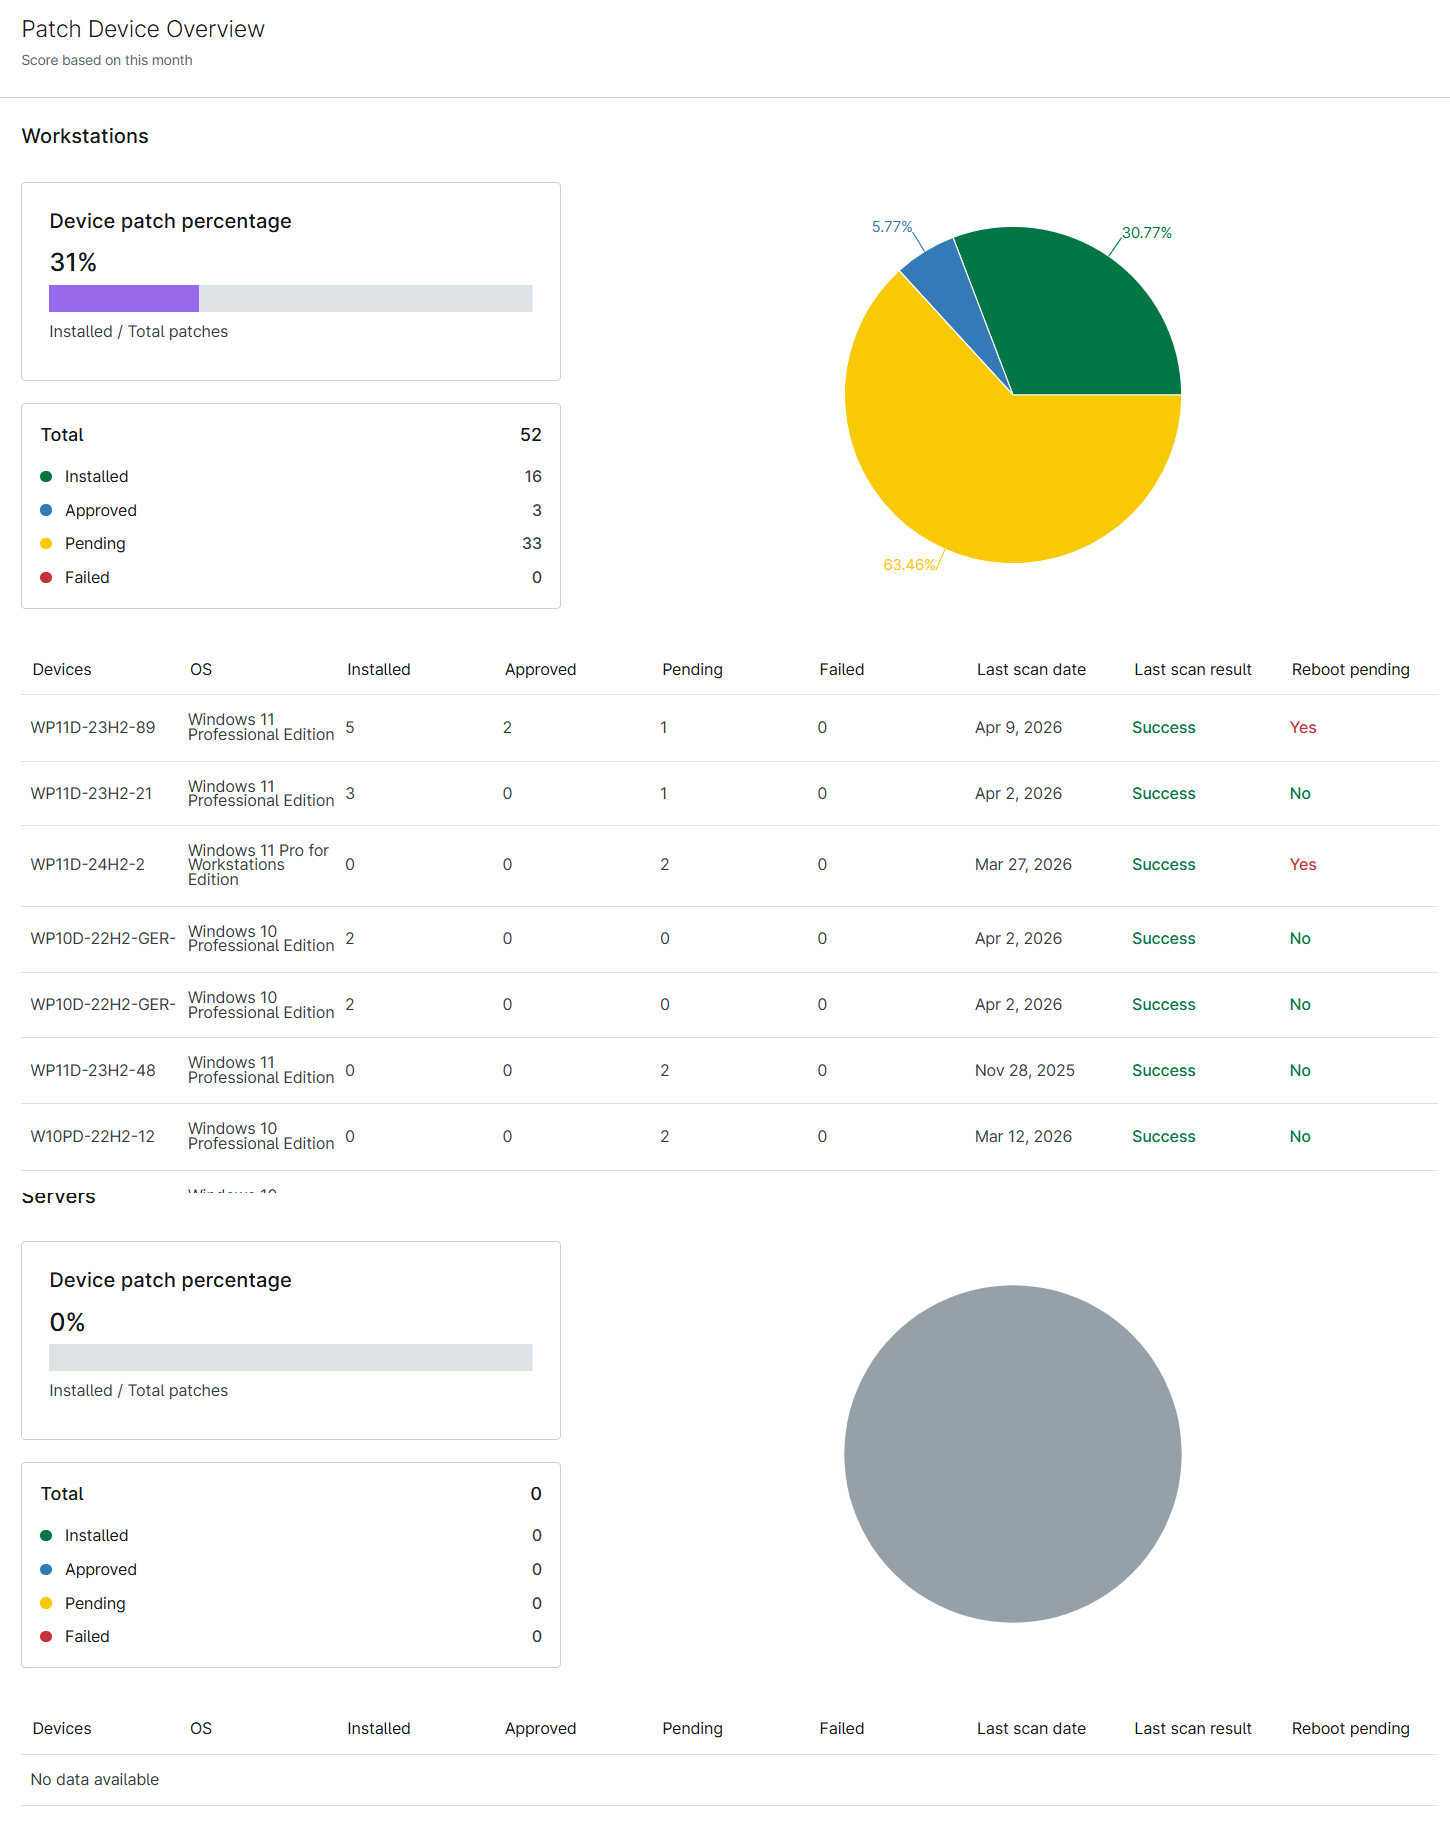
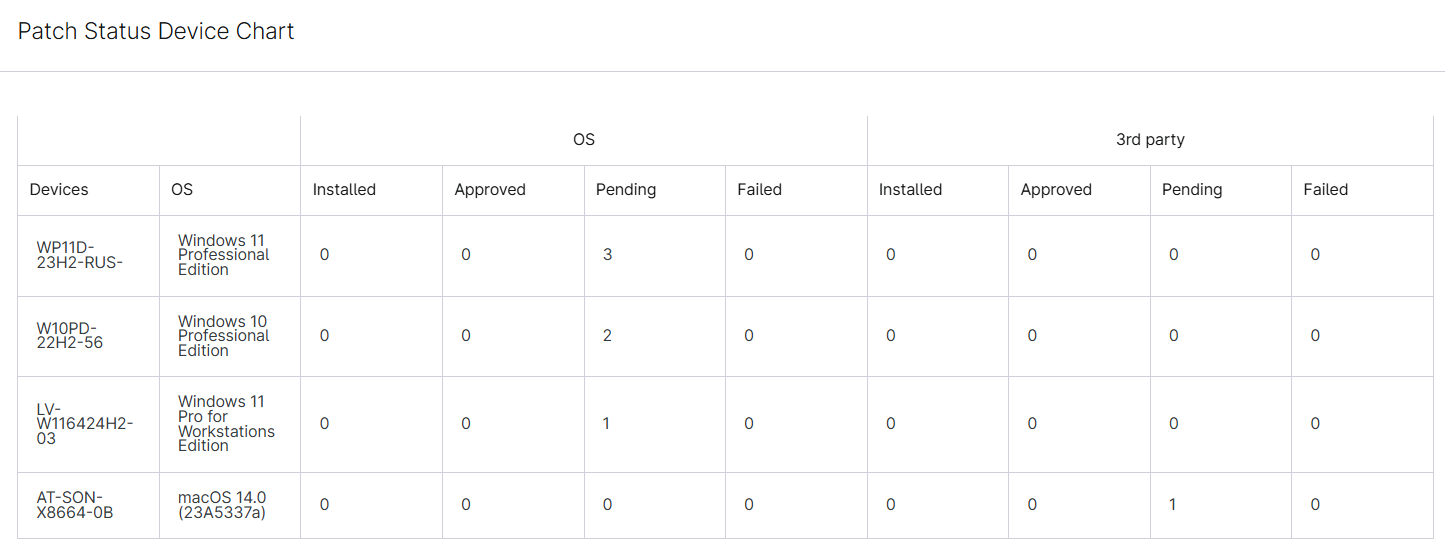
Patch Status Device Chart
This section is available for the Organization report type and shows which devices have OS or third-party patches that are installed, approved, pending, or failed.
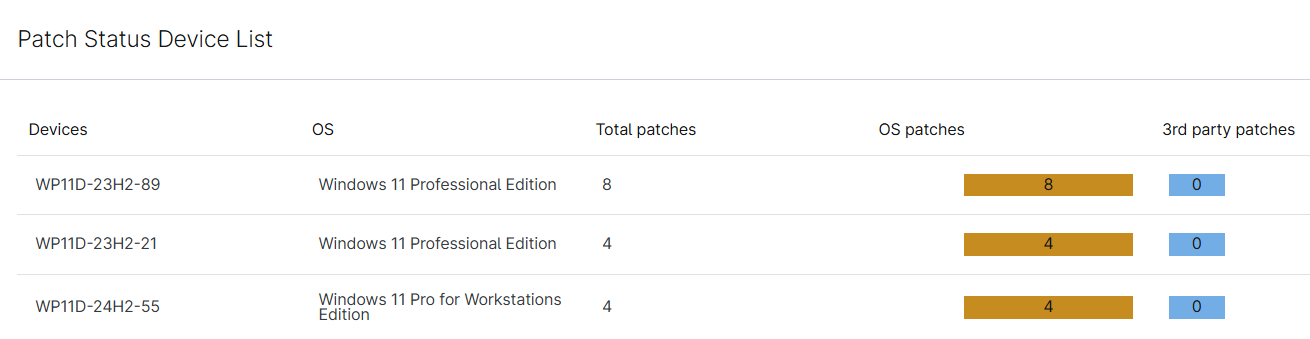
Patch Status Device List
This section is available for the Organization report type and shows the total number of patches, OS patches, and third-party patches for each device and the device's OS.
Top 50 Devices (Failed and Pending Patches)
This section is available for the Organization and Global report types and shows the top 50 devices with failed or pending OS or third-party patches, including the following data:
- Device name
- Patch count
- Last successful scan date

Top 50 Failed or Pending Patches
This section is available for the Organization and Global report types and shows the top failed or pending OS or third-party patches, including the following data:
- Patch job
- Device affected

Backup Summary Sections
Backup Boot Verification History
This section is available for the Organization and Global report types and shows boot verification results and details for devices for the selected time period, including:
- Start time
- End time
- Results
- Backup job tested
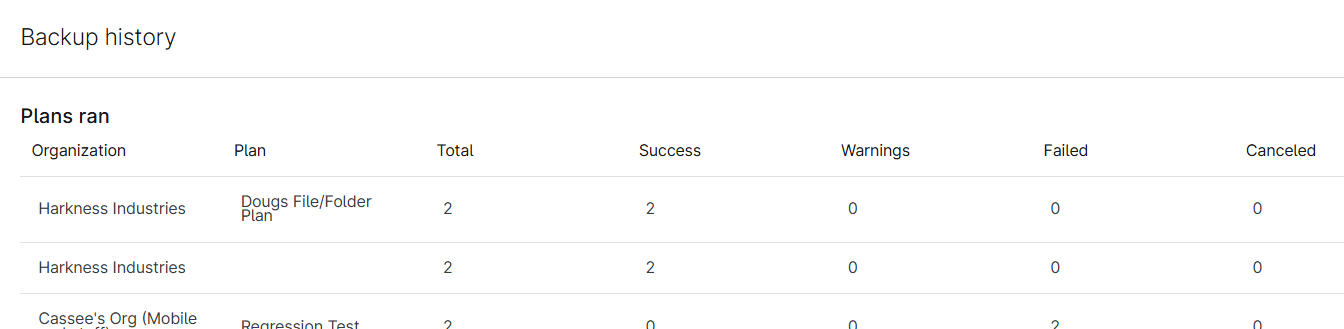
Backup History
This section is available for the Organization and Global report types and shows backup warnings and failures for the selected time period, including the following data:
- Device name
- Plan
- Type
- End
- Status
- Warnings
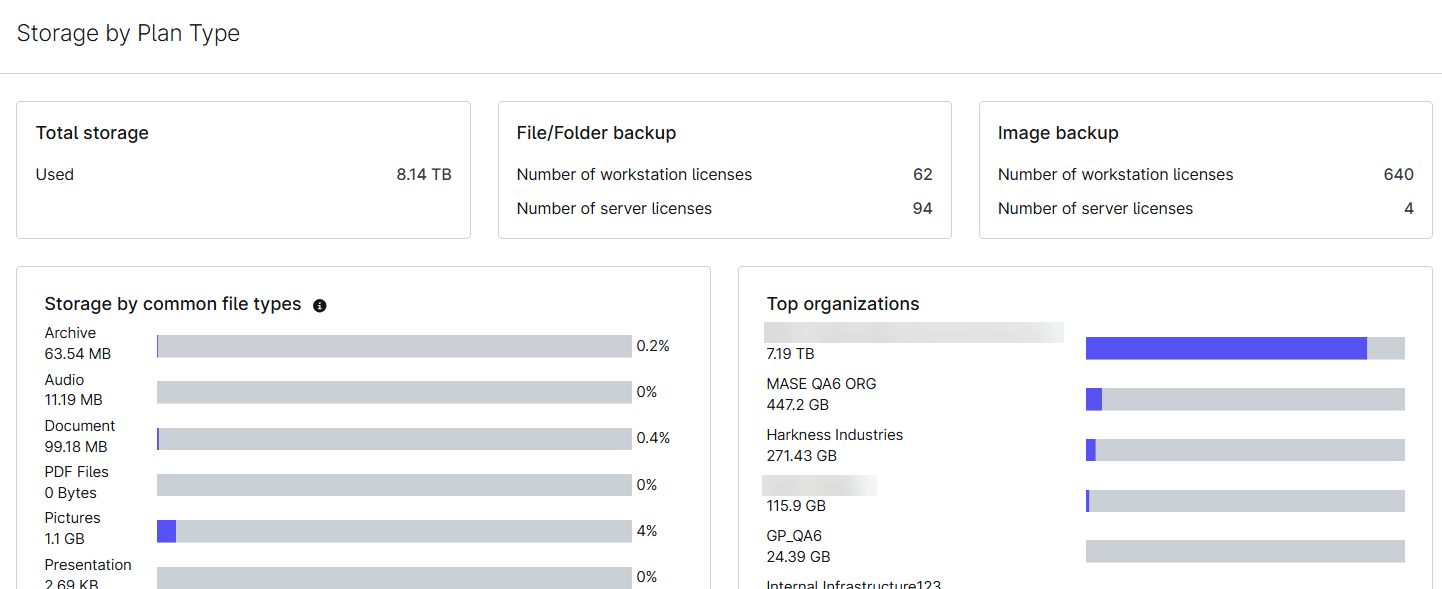
Storage by Plan Type
This section is available for the Organization and Global report types and provides the following data:
- Total Storage: lists how much backup storage you are currently using across all of the devices in this organization.
- File and Folder Backup: lists how many workstations and servers you have using file and folder backups.
- Image Backup: lists how many workstations and servers you have using image backups.
- Network Share Backup: lists how many workstations and servers you have using network share backups.
- Storage by File Type: displays your organization's total backup storage by the types of files that are backed up.
- Top Devices (or Organizations): lists the top 10 devices or organizations that are using backup data in this organization. This data changes depending on whether you use the Organization or Global report type.
Usage by Backup Type
This section is available for the Organization and Global report types and displays a graph of how much data is taken up by cloud storage versus local storage during the selected time period, and a list of the usage details for each device globally or in the organization.
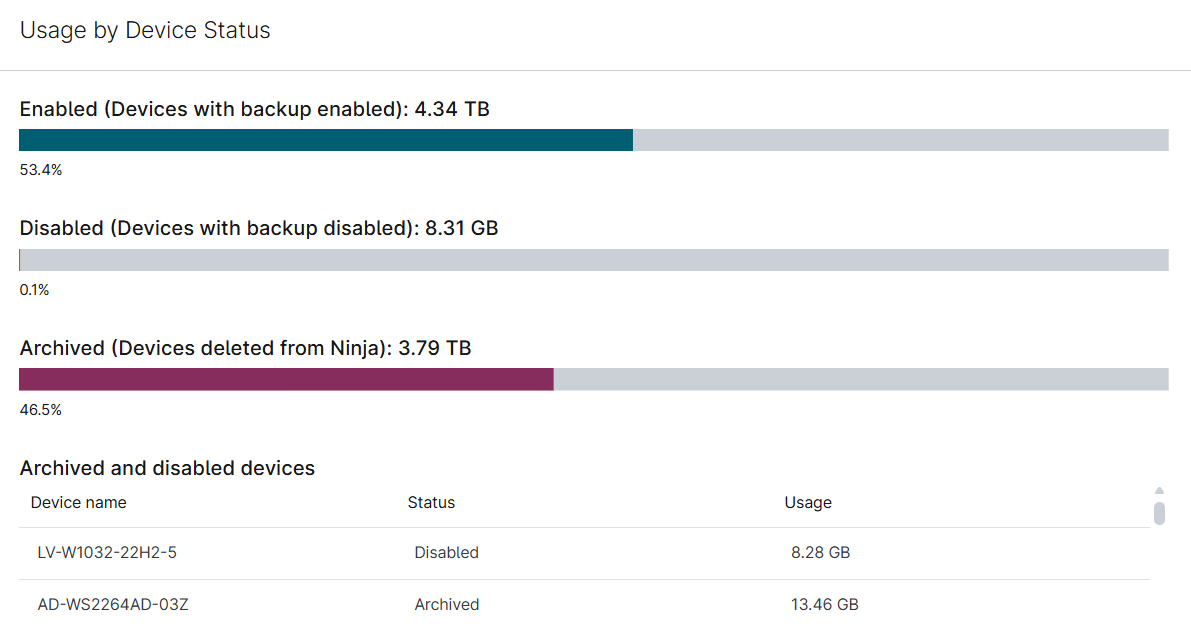
Usage by Device Status
This section is available for the Organization and Global report types and shows the data usage for the following categories, and lists devices that are deleted or deactivated:
- Enabled: data for devices that have NinjaOne Backup activated in the organization settings.
- Disabled: data for devices that no longer have NinjaOne Backup activated in the organization settings and still have backup data stored.
- Deleted: data for devices that were deleted from the NinjaOne app and still have backup data stored.
Ticketing Sections
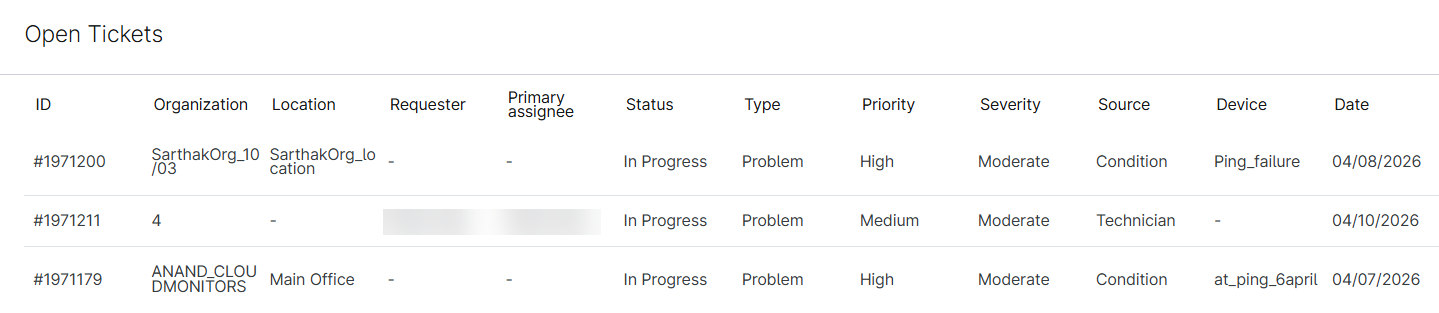
Open, Pending, or Resolved Tickets
These three sections are available for the Organization and Global report types and provide a list of all open, pending, or resolved tickets for the selected time period, including the following data:
- Ticket ID
- Location
- Requester name
- Primary assignee
- Status
- Type
- Priority
- Severity
- Source
- Device
- Date
Resolution Time
This section is available for the Organization and Global report types and provides the following data for the selected time period:
- Mean time to resolve
- One touch resolution
- First response time
- Compilation of tickets that were resolved or touched within:
- 0–5 hours
- 5–24 hours
- 1–7 days
- 7–30 days
- More than 30 days

Technician Ticket Efficiency
This section is available for the Organization and Global report types and shows the number of tickets taken and solved by each technician during the selected time period.

Ticket Volume
This section is available for the Organization and Global report types and provides the following data:
- Total status and count
- Tickets created per day
- Tickets created per hour
- Start time
- End time
- Total

Additional Resources
Refer to Reporting: Resource Catalog to learn more about our Reporting application.