
Topic
This article outlines the details of ticketing information that is shown in NinjaOne reports. To learn more about ticketing, refer to NinjaOne Ticketing: Setup and Configuration. To learn more about the Report Library, refer to Report Library.
Environment
- NinjaOne Ticketing
- NinjaOne Reports
Description
The Ticketing report is a Summary Report that can be applied to a single organization or globally. Once created, the report can be filtered to show data for a variety of data groups. If no group is selected, then all data for the selected date range will be applied. Results may be truncated to a maximum of 5,000 entries.
Select a category to learn more about the filter or report section:
- Date Ranges
- Open, Pending, and Resolved Tickets
- Resolution Time
- Ticket Volume
- Technician Ticket Efficiency
Date Ranges
The date range is a filter drop-down at the top of the report.
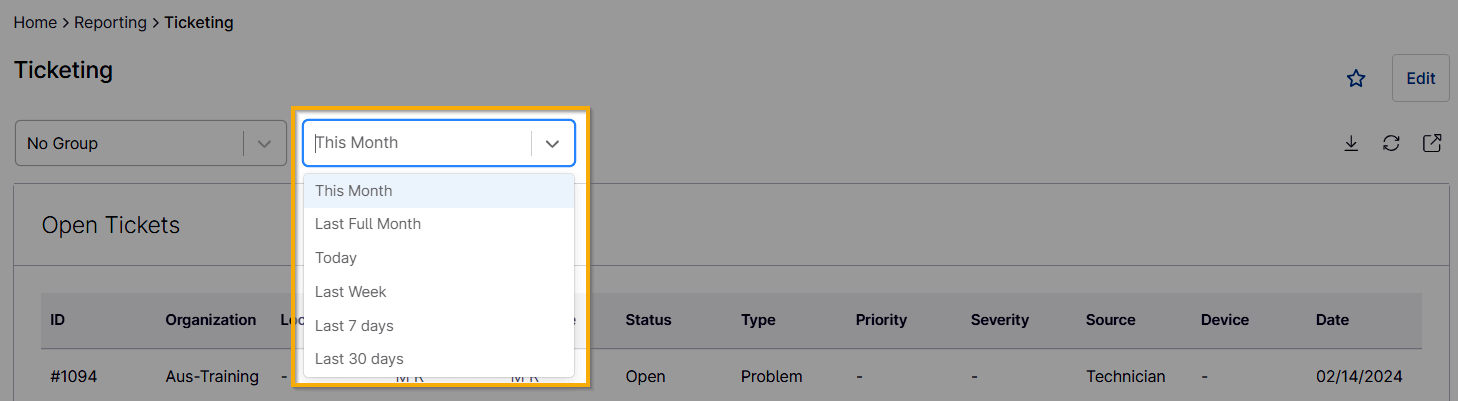
The date and time on these reports adhere to your time zone settings in NinjaOne. The time of the day starts at 00:00:00.000 or 12:00 a.m.
Only tickets created within the date range selected will appear in the report. For example, if you select "This Month" but all existing tickets were created over a month ago, then the report will be blank as they are out of range—regardless of what actions may have been taken on the ticket recently (for example, a ticket that was created 2 months ago and resolved yesterday will not appear on the report). You can use the Refresh icon  in the top right corner of the report page to load new ticket information.
| Selection | Definition |
|---|---|
| This Month | The report shows this selection by default. This is the current month, so if today is February 10, the report would show data from February 1–February 10. |
| Last Full Month | This is the most recent full month; so, if today were February 10, the report would show data from the entire month of January. |
| Today | The report shows data for the current day up to the current minute. |
| Last Week | The report shows data for the last full week (Sunday to Sunday). |
| Last 7 Days | The report shows data for the last 7 days, starting with the current day. |
| Last 30 Days | The report shows data for the last 30 days, starting with the current day. |
| Last 90 Days | The report shows data for the last 90 days, starting with the current day. This option is only available for reports targeted to organizations. |
| Custom | The report shows data for a manually selected range of dates. This option is only available for reports targeted to organizations. |
Open, Pending, and Resolved Tickets
- Open tickets are defined as tickets created within the selected date range that currently have a status of "Open" (either default or custom status).
- Pending tickets are defined as tickets created within the selected date range that currently have a status of "Waiting" (either default or custom status).
- Resolved tickets are defined as tickets created within the selected date range that currently have a status of "Resolved" or "Closed" (either default or custom status).
Resolution Time
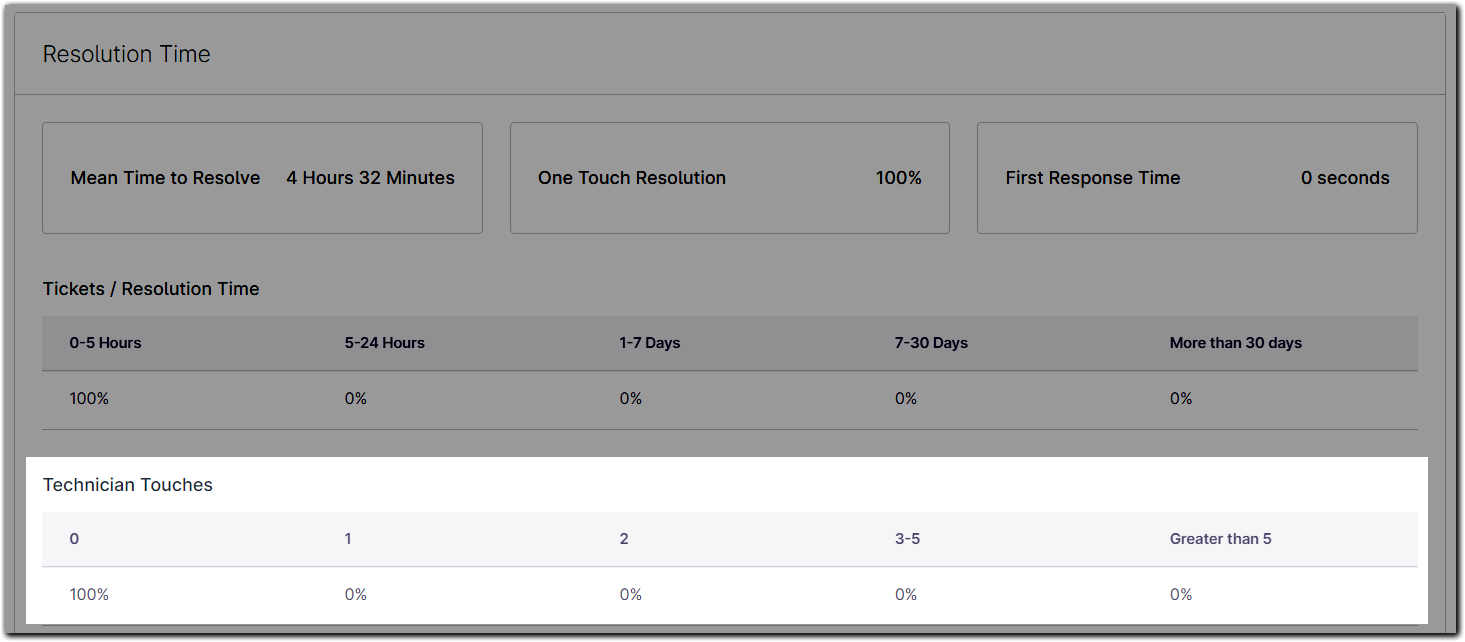
- Mean Time to Resolve: Using the tickets that are currently Resolved/Closed, is the average of the time it takes to resolve them. The time it takes to resolve a ticket is calculated from the time it was created to the last time it was moved to a Resolved status.
- If a ticket was resolved and then opened again, that ticket does not get calculated for this field.
- If a ticket was resolved, opened again, and then resolved again, the field calculates the time between when it was re-opened and resolved the final time.
- One Touch Resolution: For each ticket that is currently Resolved/Closed, it is counted how many public comments made by a technician the ticket has. Then it is calculated the percentage of those who have at most one comment
- Comments made by contacts, end users, requesters, etc. are not calculated.
- Private comments are not calculated.
- If there are four (4) tickets total, and 3 of them have one comment or fewer, then the resolution percentage will be 75% (3/4).
- First Response Time: Using tickets that have at least one public comment, is the average time elapsed between the ticket’s creation and the time of the first public comment.
- If there are no public comments on the tickets, the count will show 0 seconds.
- Private comments are not calculated.
- All public comments, including those from automations, are calculated.

Tickets/Resolution Time
Using the tickets that are currently Resolved/Closed, and the time it takes to resolve them as in Mean Time To Resolve. Percentages are calculated for each defined range using this resolve time.

Technician Touches
Using the tickets that are currently Resolved/Closed, and the count of public tech comments as in One Touch Resolution. Percentages are calculated for each defined range using these counts. The numbers indicate how many public comments were made by the technician on a single ticket (for example, 3–5 reflects tickets that have a minimum of three and maximum of five public comments present on the ticket).
The calculation accounts for all public technician comments and does not distinguish whether they were made by the same or different technicians.
Ticket Volume
Total
This section groups tickets created within the selected time range by their current status. The total number of tickets created within the selected time range is listed at the bottom.
The percentage for reopened tickets accounts for tickets that had a "Closed" or "Resolved" status and were at some point changed to an open/pending/waiting status; these can include tickets that were resolved, reopened, and closed again. If a ticket was resolved and reopened several times, it would only count once. The calculation is per ticket, not each time it was re-opened.

Tickets Created per Day
This section displays tickets created within the selected time range to show the specific day of the week they were created.
Tickets Created per Hour
This section shows a more specific time of day that the ticket was created within the selected time range. The calculation accounts for every 3 hours, starting and ending at midnight per your configured time zone.
Technician Ticket Efficiency
Tickets Taken
This section lists all technicians assigned to a ticket created within the selected date range. The calculation accounts for each time a technician was assigned, even within the same ticket (for example: if a ticket was assigned to technician 1, reassigned to technician 2, and then assigned back to technician 1, the Total would show "2" for technician 1 and "1" for technician 2).
Tickets Solved
This section accounts for tickets in the "Resolved" status only.
For Tickets Solved, the technician who set the status to "Resolved" is listed regardless of who was assigned to a ticket. For example, if ticket #1094 was assigned to Jeff H, but technician M R changed the status, then the report lists the ticket under M R.
Additional Resources
To learn more about NinjaOne Ticketing, refer to Ticketing: Resource Catalog.
To learn more about NinjaOne Reporting, refer to Reporting: Resource Catalog.