Topic
This article explains how to create policies and monitor virtual machines (VMs) in NinjaOne.
Environment
NinjaOne Endpoint Management
Description
In NinjaOne, monitoring conditions are rules that define what a platform watches for on a managed device and what happens when a threshold is crossed. Each condition specifies:
- What to monitor: a specific metric or state, such as CPU usage, disk space, service status, or device connectivity.
- The threshold: the value or state that constitutes a problem, such as CPU usage exceeding 90% or a service stopping unexpectedly.
- The severity: how critical the condition is when triggered, which typically influences how it's prioritized.
- The response: what happens when the condition is met, such as generating an alert, creating a ticket, or sending a notification to a technician or channel.
For virtual machines, NinjaOne bundles conditions into VM policies, which let you define a standard set of monitoring rules and apply them to individual or multiple VMs, rather than configuring each device individually.
Select a topic to learn more:
Creating Policies for VM Monitoring
There are two VM policy types for monitoring:
- Host policies: The host is the physical (or virtual) device that runs the hypervisor. For Hyper-V, the host is a Windows Server device with the Hyper-V role installed. For VMware ESXi, the host is the ESXi server itself. The host is the underlying hardware and operating system layer that allocates resources to virtual machines.
- Guest policies: A guest is a virtual machine running above the host. One host can run many guests simultaneously.
To set up either type of VM policy, perform the following steps:
- In NinjaOne, navigate to Administration → Policies → VM Policies and click Add VM Policy.
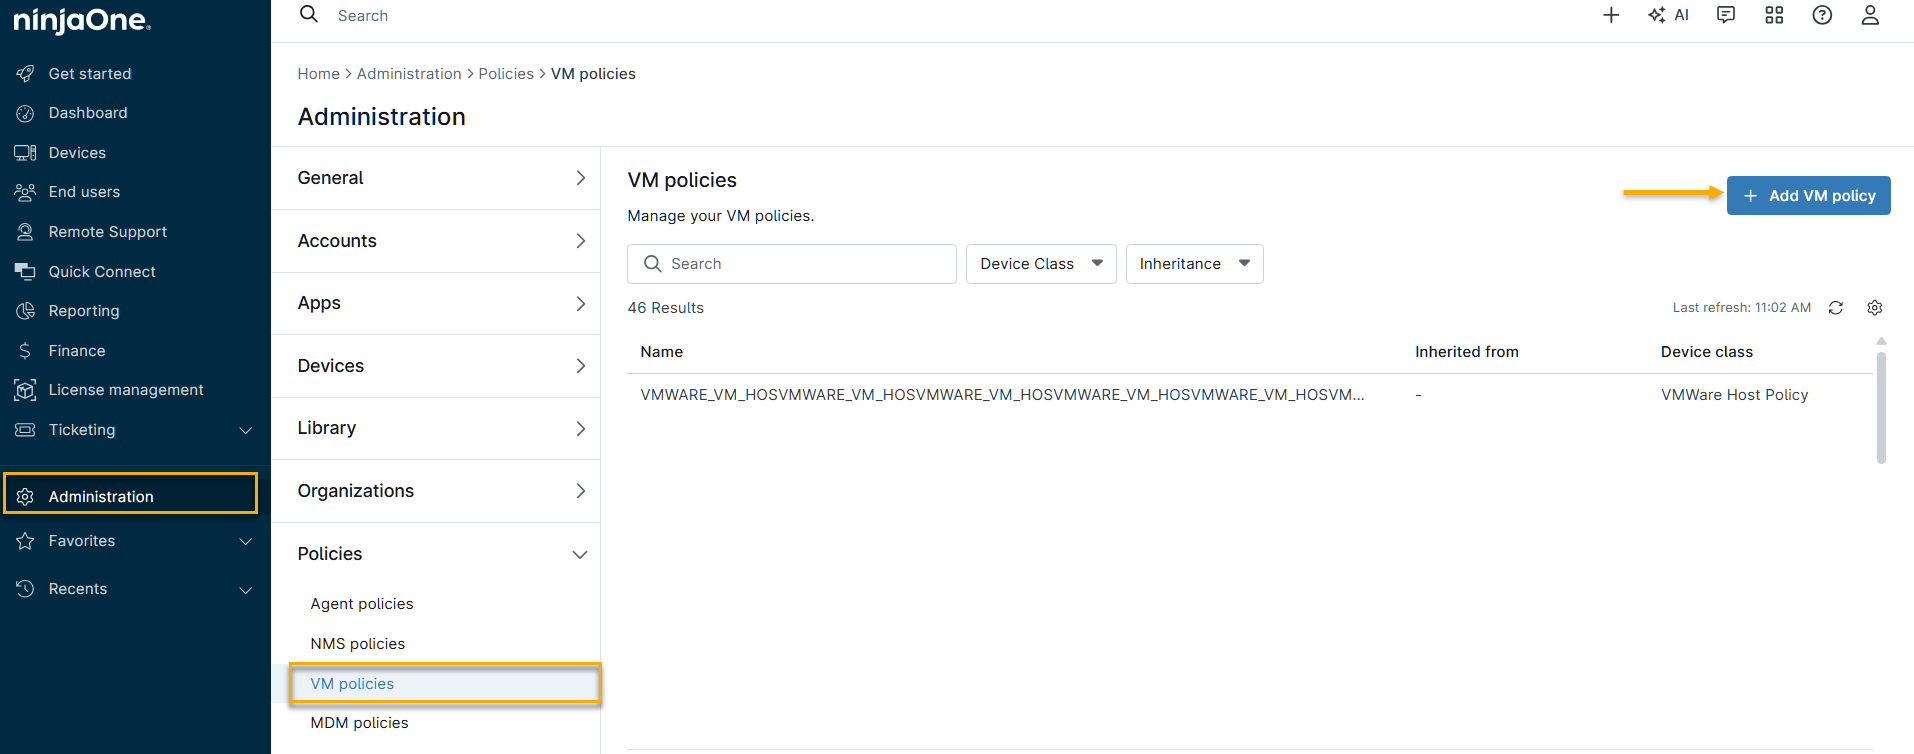
- The Create a policy window opens. Enter the following information, then click Create. The new policy appears in the Policies list on the VM Policies page. Refer to NinjaOne Policies: Create and Manage a Policy for more information about creating policies.
| Field | Description |
|---|---|
| Name | Give your policy a descriptive name so you can identify it in the Policies list. |
| Description | Use this text field to document what the policy is for or which devices it applies to. |
| Role |
Determine what type of device the policy applies to. The policy type you select determines what conditions and monitoring options are available in the policy.
|
| Parent policy | Allow the new policy to inherit settings from an existing policy. If you select a parent, the new policy starts with the parent's conditions and configuration, which you can then extend or override. |
| Policy enabled | Activate or deactivate the policy. This setting is activated by default, but you can deactivate the policy if you want to configure it before it goes live. |
Editing and Adding Monitoring Conditions
New VM policies include multiple pre-configured conditions by default. You can edit these conditions to suit your needs or add new conditions.
- Click a condition to edit the settings. You can change condition thresholds, severity and priority, define reset parameters, set up notifications for channels or technician accounts, and create tickets from triggered conditions.
- Click Add a condition to add more conditions to the policy. For more information, refer to NinjaOne Policies: Condition Configuration.
Navigating the VM Dashboards in NinjaOne
A successfully added host is listed as a device in NinjaOne. However, the regular Windows workstation or server instance of the device in NinjaOne is listed as a separate entity and has its own dashboard. For more information about dashboards, refer to NinjaOne Dashboards: Resource Catalog.
The host device dashboard has six main tabs:
- Overview
- Details
- Asset
- Settings
- VM List
- Activities
Overview
The Overview tab contains three main sections: Performance, General, and Activities. Depending on whether the device has any triggered conditions, there may also be a Health section towards the bottom of the page.
| Section | Description |
|---|---|
| Performance | Provides graphs that indicate the recent performance of the device's CPU, memory, datastore, and network adapters. |
| General |
Provides the following information about the device:
The organization, policy, and delegate values provide a hyperlink to each respective item in NinjaOne. |
| Activities | Provides the activity feed for the device. Select Notes to view any current device notes. |
| Health | This section appears if there are currently any conditions triggered on the device. NinjaOne hides this section if the device is healthy. |
Details
The Details tab has four main sections: Processor, Memory, Datastore, and Network.
| Section | Description |
|---|---|
| Processor | Provides information about the processor and CPU utilization on the device such as the number of cores, threads, and CPU speed. |
| Memory | Provides information about the memory usage on the device such as the amount of memory in use, the total amount, and the amount available. |
| Datastore | Provides information about the datastore on the device such as the read and write speeds. |
| Network | Provides graphs of the throughput for each network adapter. |
Asset
View and update asset field information from this tab. Click the pencil icon to edit the data. You can find this information on the Devices search page.
Settings
From the Settings tab, you can:
- View the FQDN
- View or edit the display name; refer to NinjaOne Endpoint Management: Change a Device Display Name for more information.
- View or edit the organization that the device belongs to, and view or edit the location
- View or edit the policy to which the device belongs; refer to NinjaOne Endpoint Management: Change or Override a Device Policy for more information.
- Edit or clear any device-level policy overrides
VM List
In this tab, NinjaOne displays a list of all virtual machines that the host is monitoring.
- Filter the list by using the search field and drop-down menus at the top of the list.
- Click the virtual machine's name to access its device dashboard in NinjaOne.
To perform actions on a virtual machine, select the checkbox next to the name and then click any of the options that appear above the list.
The actions available depend on the machine's current status.
| Actions Available | Required State |
|---|---|
| Start | Off |
| Shut down | On |
| Turn off | On |
| Reset | On |
| Save | On |
| Delete | Off |
| Pause | On |
- You can run actions across multiple machines in bulk, but the machines selected must currently be in the same status (for example, all machines must currently be off).
- Turn off is the equivalent of unplugging a machine, whereas Shut down sends a shutdown message to the guest.
- The Save function writes the contents of the VM’s RAM to the hard disk. Other VMs can then use the released RAM.
- The Pause function only pauses the CPU and prevents it from executing any instructions.
- If you choose to delete, NinjaOne deletes the VM from the Hyper-V server in addition to the NinjaOne UI, and displays a confirmation prompt. NinjaOne also performs this action if you delete a VM from the Hyper-V guest itself in NinjaOne.
Activities
This tab displays all activities performed for the device in question. Refer to NinjaOne Endpoint Management: Device and System Activity Notification Feed for more information.