Topic
This guide explains the different dashboards available with NinjaOne Device Backup.
Environment
NinjaOne Device Backup
Description
NinjaOne Device Backup dashboards let you easily monitor and manage your backups. This article explains how the device backup dashboards work. Click the links below for more details on each topic.
Dashboard Levels
NinjaOne Device Backup provides dashboards at the global, organizational, and device levels. The information presented will vary depending on the level you are viewing. The following sections explain each level.
Global-Level Dashboards
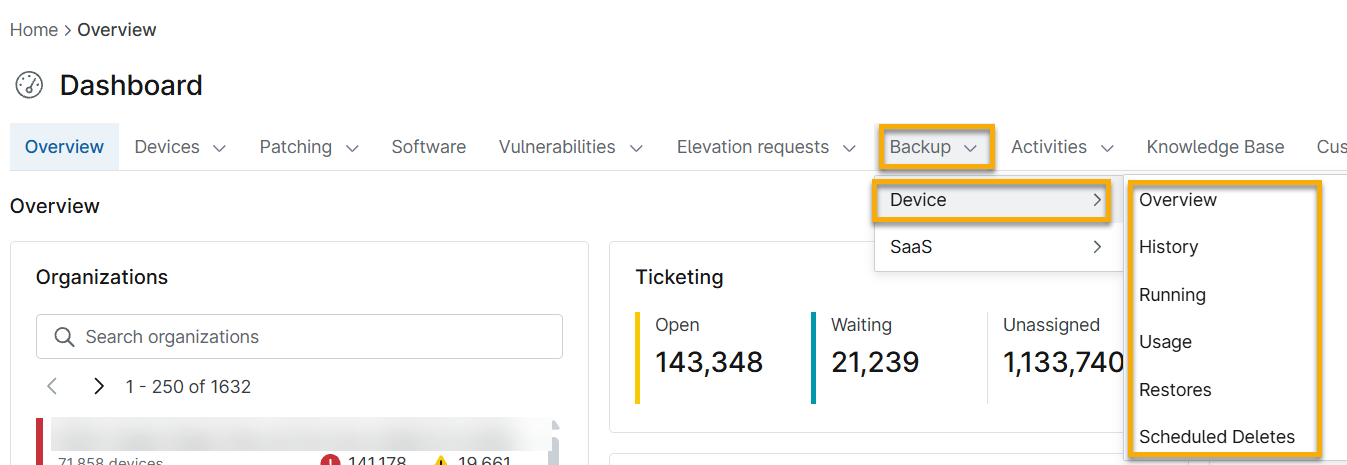
Global-level dashboards include information for all the organizations you manage in NinjaOne Device Backup. To access the global backup dashboards, click Dashboard in the main NinjaOne navigation menu and then select Backup. Move your cursor over Device in the drop-down menu to display the available device backup dashboard options. The options include: Overview, History, Running, Usage, and Restores. You may also see Scheduled Deletes if any exist.
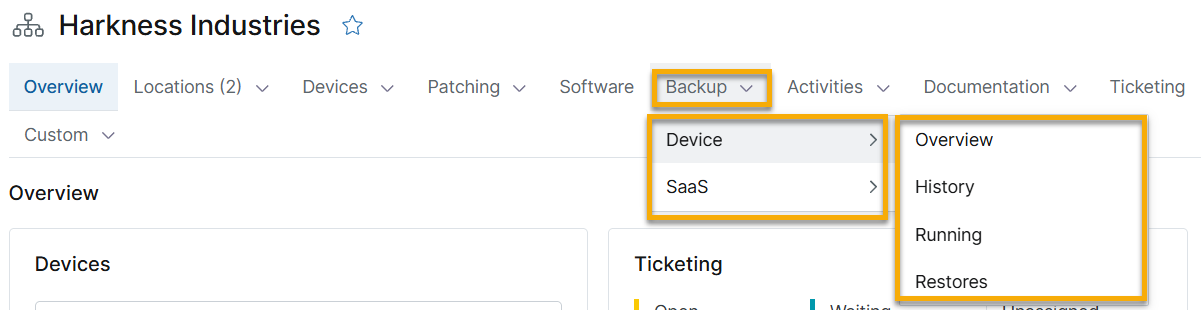
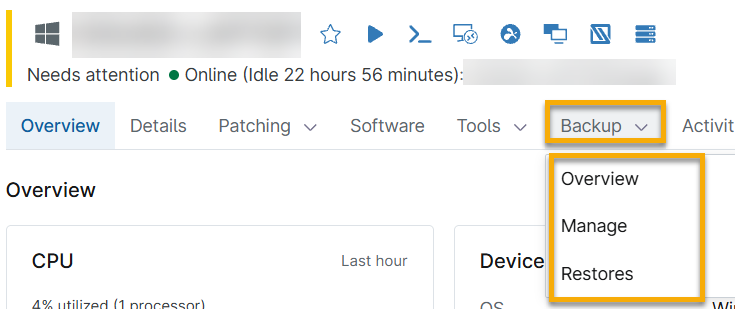
Device-Level Dashboards
Device-level dashboards display information related to a specific device. You can access the device-level backup dashboards by navigating to an individual device overview page and selecting Backup in the navigation menu. You'll have three different options at this level: Overview, Manage, and Restores.
Backup Dashboards
Each item listed in the Backup drop-down menu links to its own specialized dashboard with information about a specific topic. The data presented on each dashboard will vary depending on whether you are at the global, organization, or device level. The data may also vary depending on the specific features you have activated. For example, NinjaOne will not display boot verification data if you have not activated the boot verification feature.
All the dashboards feature drop-down menus that you can use to filter the data displayed. You can also click the gear icon to sort or filter the columns.
The following sections provide a description of the data provided by each backup dashboard.
Overview
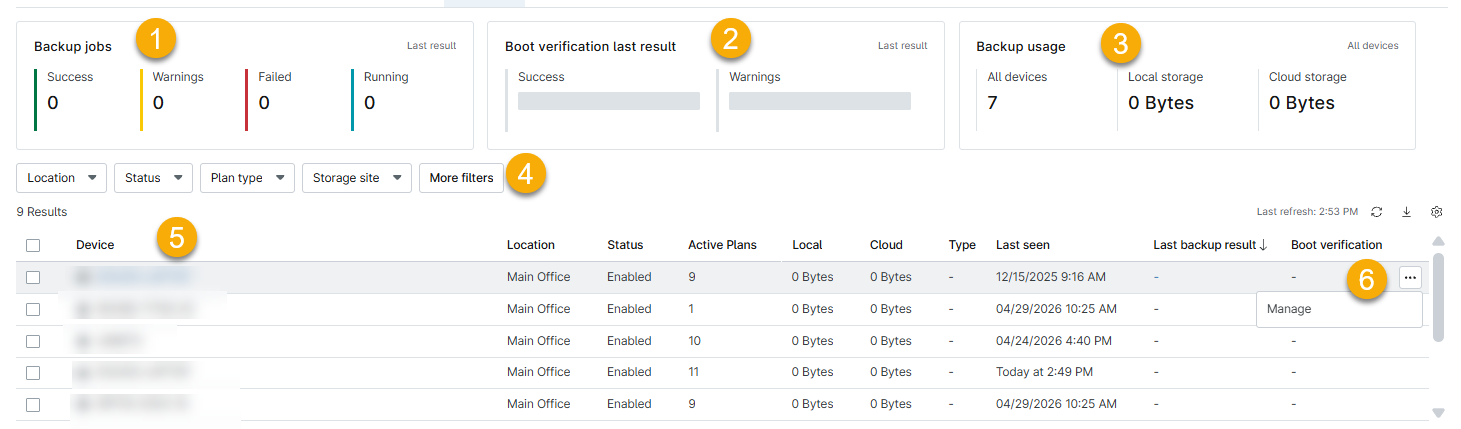
The overview dashboard serves as the primary backup dashboard at each level. NinjaOne displays a series of cards along the header section of the dashboard, providing details on various backup parameters. You can filter the data displayed in the card by placing your cursor in the upper-right corner of the card to reveal a drop-down menu of filter options. Click in the card to go directly to the data table for that parameter.
Here are the key areas within the overview dashboard:
- Backup jobs: This section is available on all overview dashboard levels. The card displays the total number of backup plans that have executed during the current day. It also shows how many of those plans were completed successfully, completed with warnings, have failed, or are currently running. You can change the data shown in this section by placing your cursor over the last result icon area until a drop-down menu appears. Select one of the available options to filter job history by current day, seven days, one month, or three months. You can click the results displayed in the card to view a dialog that shows comprehensive job results data.
- Boot verification last result: This section will display on the global or organization-level overview dashboard if you've activated the boot verification feature for your Microsoft Windows servers. NinjaOne will display the results of your boot verifications in the card. The display shows the number of successful verifications and those that completed with warnings. You can click the status displayed in the card to view the History dashboard with results filtered to show the results of the most recent boot verifications. For more information about boot verification, refer to NinjaOne Device Backup: Boot Verification.
- Backup usage: This section displays both local and cloud storage used by your backups. You can view all devices or filter the results to display only workstations or servers.
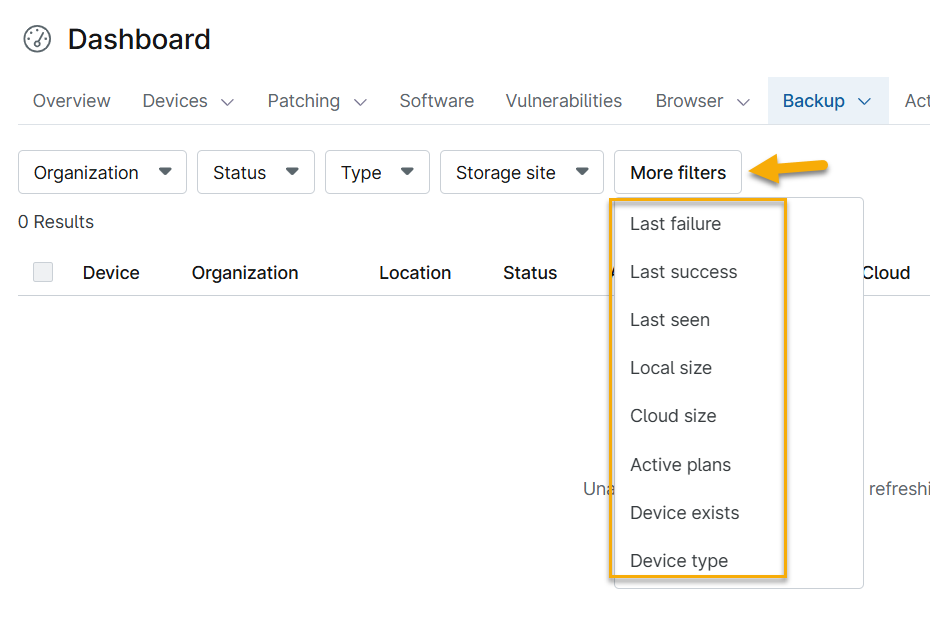
- Drop-down menus: Below the header section, NinjaOne will display a series of drop-down menus. Click any of the drop-down boxes to filter the data presented in the table below them. You can click More filters for additional filtering options.
- Data table. The data table displays relevant backup information for the dashboard level you are viewing. The information presented in the table will vary depending on whether you are at the global, organization, or device level. Depending on the data presented, you may have the option to select a row or re-order a column. Some fields are clickable and will link to more detailed information.
- Actions menu. Place your cursor over any row in the table to reveal the actions menu. The actions menu provides direct links to various device backup sections. The links displayed will vary depending on whether you are at the global, organization, or device level dashboard.
The overview dashboards at each level are a great way to determine backup status quickly. The other available dashboards described below provide a deep dive into a specific area of backup information.
History
The History dashboard is available at the global and organization levels and lists all backup jobs that have run on the devices in your NinjaOne environment.
The History dashboard displays the following information about your backups:
| Column Name | Description |
|---|---|
| Device | The name of the device and the organization it belongs to (contains a hyperlink to the device dashboard). |
| Organization | On the global dashboard only. The organization that the device belongs to. This column contains a hyperlink to the organization dashboard. |
| Location | On the organization dashboard only. The specific location in the organization. |
| Plan | The name of the plan that ran. |
| Destination | The location where the backup is stored. |
| Type | The type of plan. |
| Status | The completion status of the backup plan. Running, Completed, or Failed. A 375 code listed here indicates a technician canceled the job. NinjaOne Device Backup counts canceled jobs as failed. For more details, click the status to display the job results dialog. |
| Log | This notice indicates whether there are warnings or errors for the backup. Click the log entry to view the warning or error details. |
| Size | The amount of data stored at the destination. |
| Start | The date and time the backup job started. |
| Finish | The completion time for the plan. |
Running
The Running dashboard is available at the global and organization-level and lists any active backup jobs on devices in your NinjaOne environment or for that organization. This section provides the following data:
| Column Name | Description |
|---|---|
| Device | The name of the device and the organization it is at, which contains a hyperlink to the device dashboard. |
| Organization | The organization that the device belongs to, and a hyperlink to the organization dashboard. This listing is available on the global dashboard only. |
| Plan | The name of the plan that is running. |
| Type | The type of plan. |
| Direction | The location of the backup information. |
| Start | The start date of the job in the division's time zone. |
| Data sent | The amount of data backed up so far. |
| Progress | NinjaOne Device Backup shows the progress percentage for the backup job in real time. Image backups that include local storage will also display validation information that includes the number of blocks that have been validated in real time. |
| Files uploaded | The number of files that have been uploaded so far, out of the total number of files to be uploaded. |
Usage
The Usage dashboard is only available at the global level and displays the data usage for each device that currently has NinjaOne Device Backup activated. This dashboard shows the following data:
| Column Name | Description |
|---|---|
| Device | The name of the device and the organization it belongs to (contains a hyperlink to the device dashboard). |
| Organization | The organization that the device belongs to (contains a hyperlink to the organization dashboard). |
| Location | The location within the organization. |
| Status | The current backup status for that device.
|
| Active Plans | The number of NinjaOne Device Backup plans currently running for that device. |
| Local | The amount of data stored locally. |
| Cloud | The amount of data stored in the Cloud. |
| Type | The type of plan. |
| Last seen | Last contact time of the Ninja RMM agent for nodes in the backup dashboards. |
| Backup Last success | The date of the last successful backup job. If no value is listed, NinjaOne Device Backup has not performed a successful backup on the device. |
| Backup Last Failure | The date of the last backup job failure on the device. |
You can also sort this list by any of the categories listed. Click More Filters to display additional filter options.
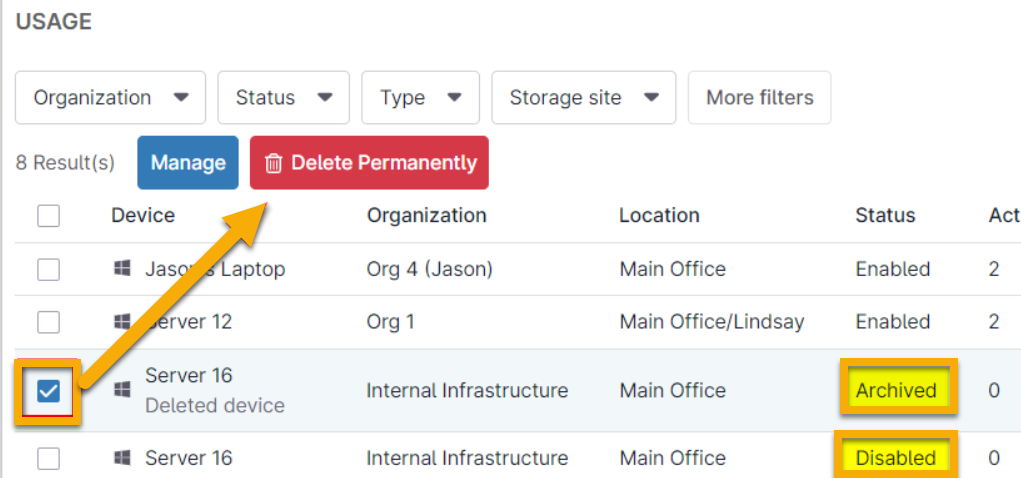
If you activate the checkbox next to a device, a few actions appear at the top of the list. For all devices, regardless of status, you can navigate directly to the backup data manager for that device.
For devices with a status of Disabled or Archived, you have the options to navigate directly to the backup data manager for that device (which allows you to restore data from a deleted device), and an additional option to permanently delete the backup data associated with that device.
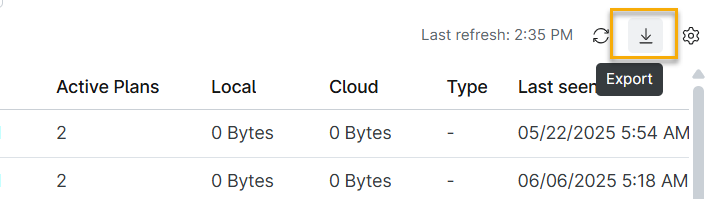
Finally, use the Export button in the top-right corner of the Usage section to export the usage data to a CSV file, which will automatically download to your machine.
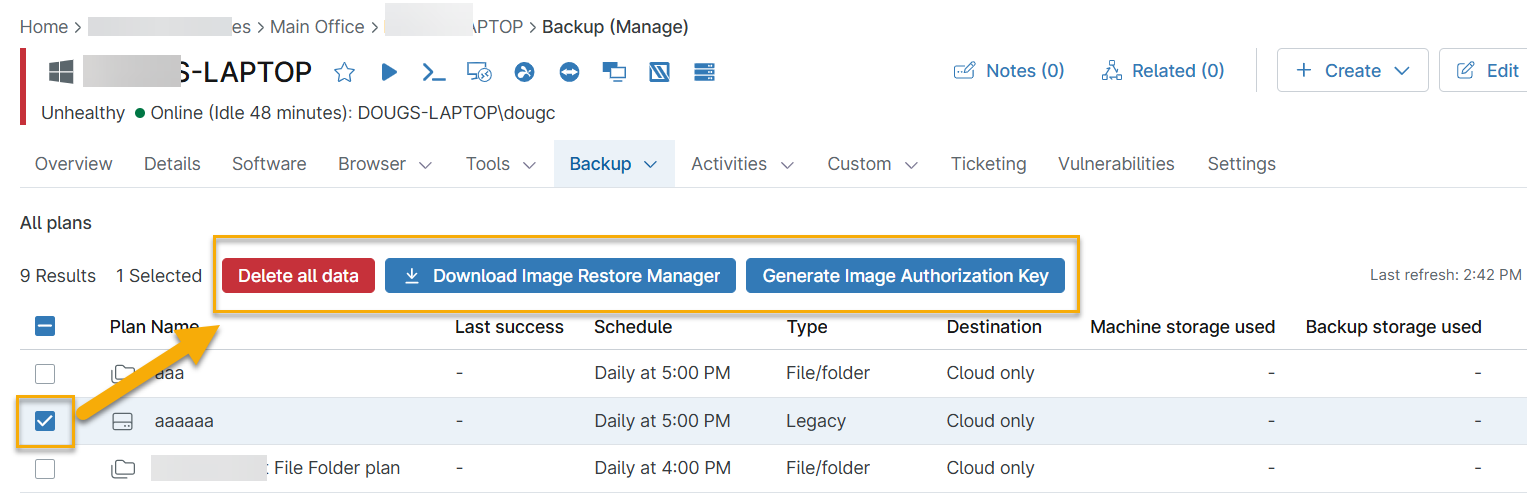
Manage
This section is available only at the device level. It displays all backed-up data and allows you to select backups for downloads, restores, or deletion.
Restores
The Restores dashboard is available at all levels and lists all restore jobs on devices in your NinjaOne environment or for the specific organization or device. This dashboard provides the following data:
| Column Name | Description |
|---|---|
| Device | On the global and organizational level only. The name of the device and the organization it is in, which contains a hyperlink to the device dashboard. |
| Organization | On the global level only. The organization that the device belongs to, and a hyperlink to the organization dashboard. |
| Location | On the organization level only. The specific location in the organization. |
| Plan | The name of the backup plan. |
| Source | The source of the backup data. Cloud or local. |
| Type | The backup plan type. Image or File/Folder. |
| Start | The date and time that the restore started. |
| Job status | The current job status |
| Size | The current job size. |
Scheduled Deletes
The Scheduled Deletes table is available at the global level and displays data relevant to any scheduled data deletions. Listed information includes the following data:
| Column Name | Description |
|---|---|
| Organization | The organization that owns the data. |
| Device | The device the data belongs to. Click the device name to open |
| Deletion type | The associated backup plan. |
| Size | The size of the data. |
| Location | Where the backup data currently resides. |
| Scheduled by | The technician who scheduled the deletion. |
| Requested date | The date of the deletion request. |
| Scheduled date | The scheduled date for the deletion. |
| Details | Click the View link to view deletion details. |
Additional Resources
For more information about backup data protection, review our NinjaOne Device Backup: Resource Catalog NinjaOne Device Backup article.