Topic
NinjaOne's Report Library allows you to track data across a broad spectrum of features for your organizations and devices. To learn about what specific data is captured in reports, please see Reporting: Types of Reports.
Environment
NinjaOne Reporting
Index
- Overview
- Create a New Report Template
- View the Report Dashboard
- Schedule a Report
- View Report History
- Add Your Own Logo to Your Reports
- Delete Reports
Overview:
The new Report Library adds a Reporting tab to the left side navigation pane in the NinjaOne platform. This replaces the Reporting section under Administration. 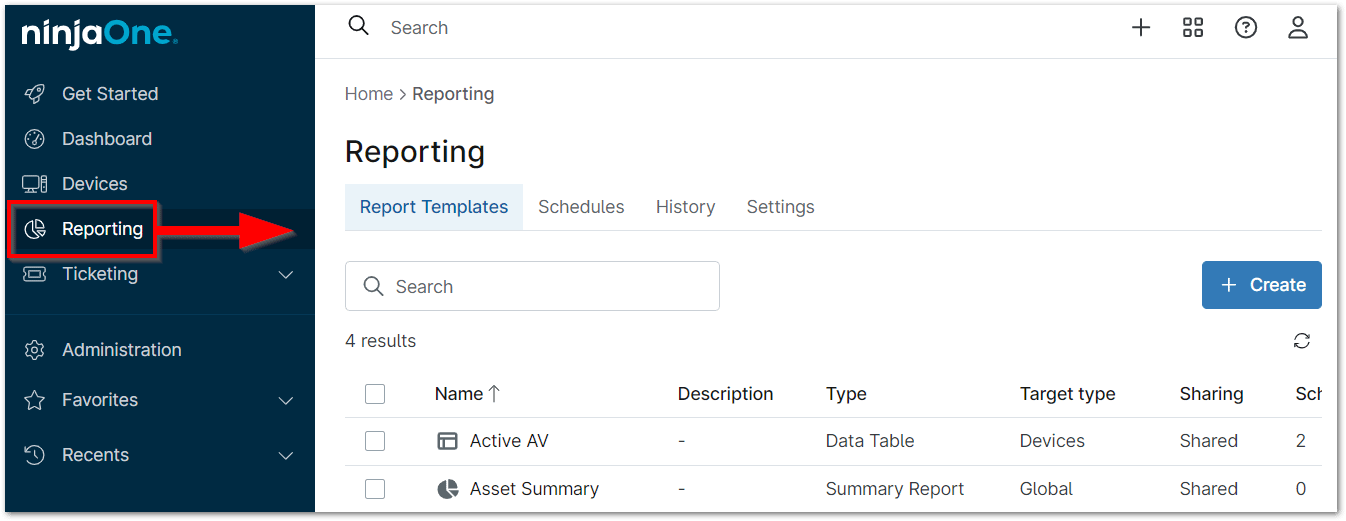
Moving from Legacy Reporting to the Report Library
Every legacy report (i.e., reports that existed before the new Report Library tab was added to the sidebar) will be replicated in both the Report Templates and Schedules tab. These are easily identified by the “migrated” tag next to the report name. There will be no disruption to your scheduled report emails. 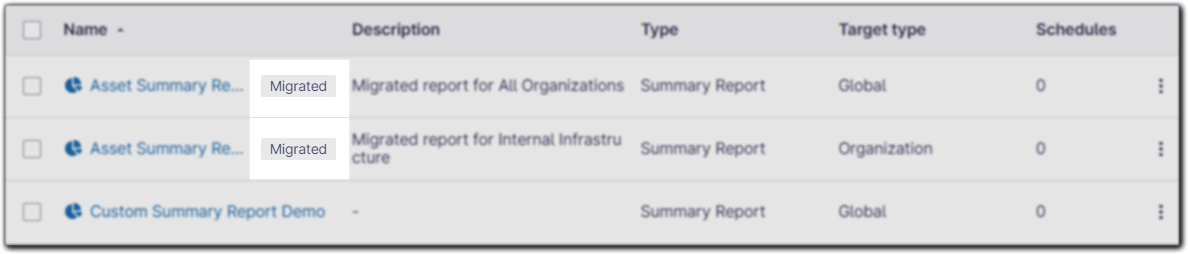
Technician Permissions:
To access the Report Library, technicians need a minimum of "View and Schedule" permissions under Account editor > System > Manage Reports. If given "Full Access", a technician should have access to organizations and devices depending on reporting responsibilities.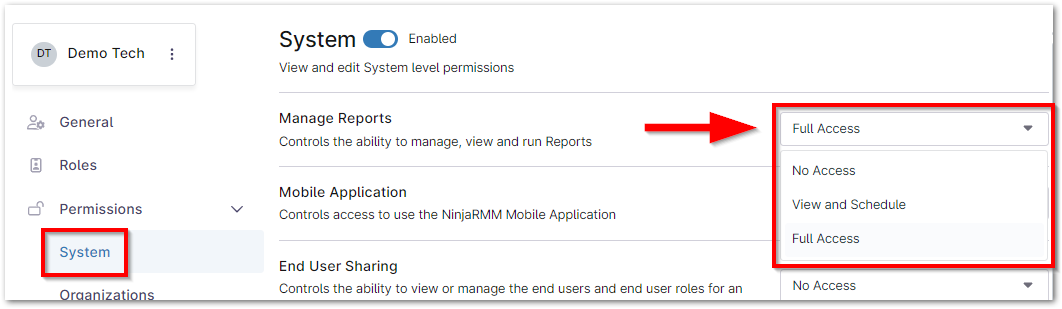
Creating a New Report Template:
Important Notes:
- Only system administrators are able to create and view global reports; technicians can create organization reports only for the organizations to which they have access.
- Organization Summary reports and Data Table reports are available to non-system administrators according to system permissions (i.e., the "Manage Reports" system permission is set to a minimum of "View") and access to a minimum of one (1) organization. If the technician does not have access to organizations, the Reporting tab does not display on the left navigation pane and the technician will not have access to any of those reports.
- The "Blank" template provides an empty report with no report sections pre-selected.
- Click Reporting in the left side navigation pane and then click Create in the top right corner.
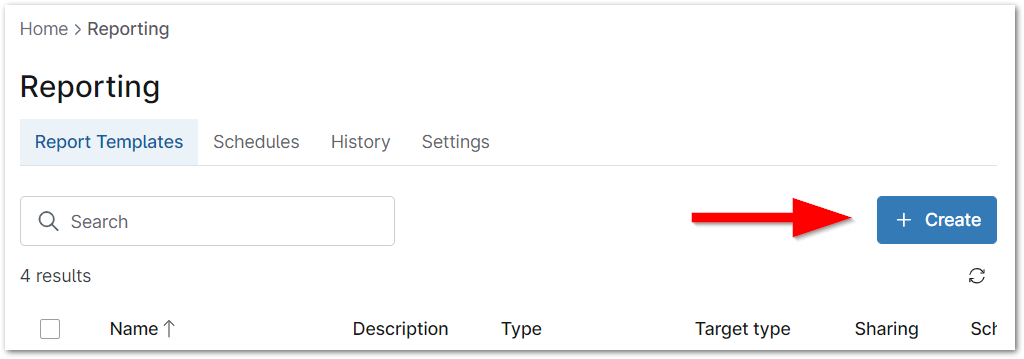
- Select either Summary Report, Data Table, or Runbooks Report. See below for details of each report type.
Summary Report
- Give the new report a name and description (optional).
- Choose whether the report should be global (all organizations) or specific to a single organization.
- Select which template to build the report from.
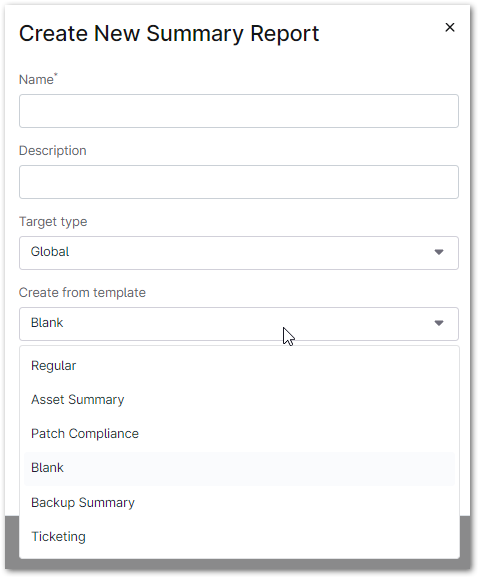
- Decide whether you want to share the report. Then, click Create.
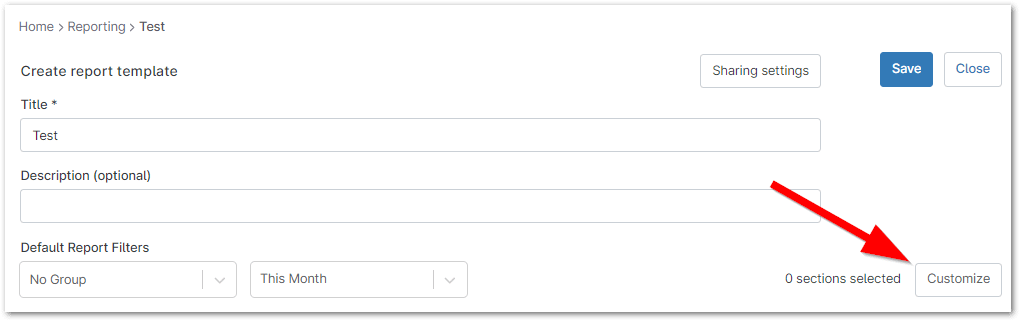
The report editor modal displays. - Select Customize to add and modify the sections that will be included in the report.
The Sections editor modal displays. - Add sections to the report using the drop-list or remove sections by clicking the X to the right of the section name.
- Click and drag sections to rearrange the order.
- Once the sections have been properly configured, click OK.
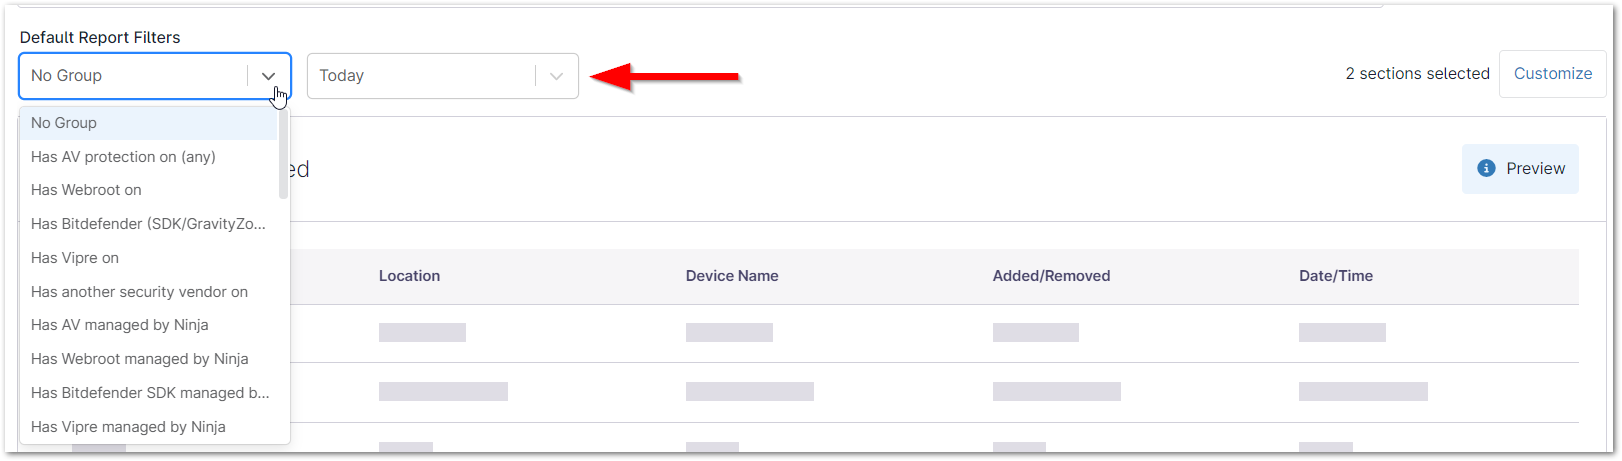
The updated section(s) display under the Preview section on the report editor. - You can filter the selected sections by time scope (last full month, current day, last week [Sunday to Sunday], and last 7 days) or by a certain device group. If the report has "Organization" as the target type, an additional drop-down for organization selection appears here.
- If the sections under Preview are customized to your preference, click Save in the top right to set the configured settings for the template.
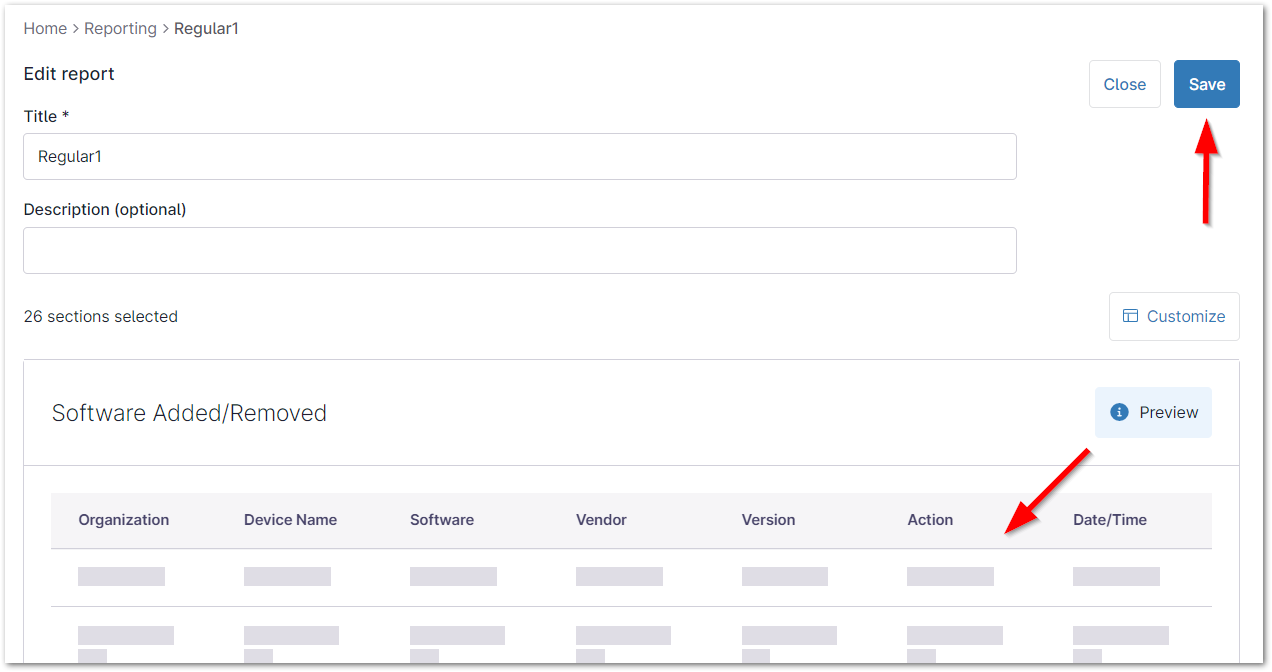
- Click Close to view the dashboard for the report.
Data Table
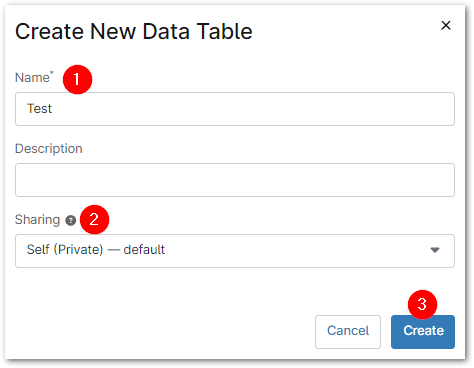
- Enter a title and (optionally) a description for the new data table report.
- Decide whether you want to share the report.
- Click Create.
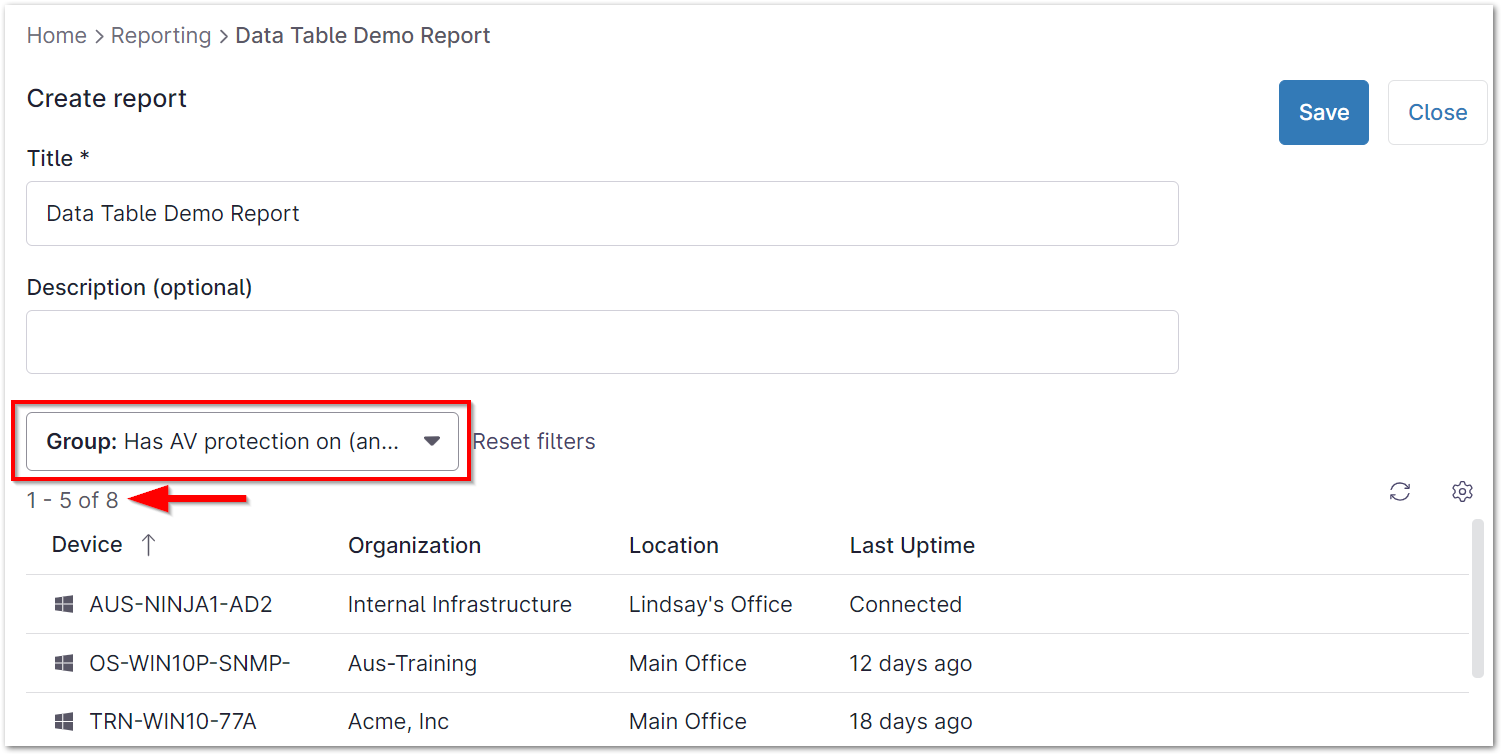
The report editor page displays. - Select an option from the Group dropdown to see a list of devices that match the group criteria. Once a group is selected, a few device rows display as a preview. The total number of devices included in the group displays at the top of the list.
- Click the gear icon to the right of the group list to customize the device list, add/remove columns, or reorder the data.
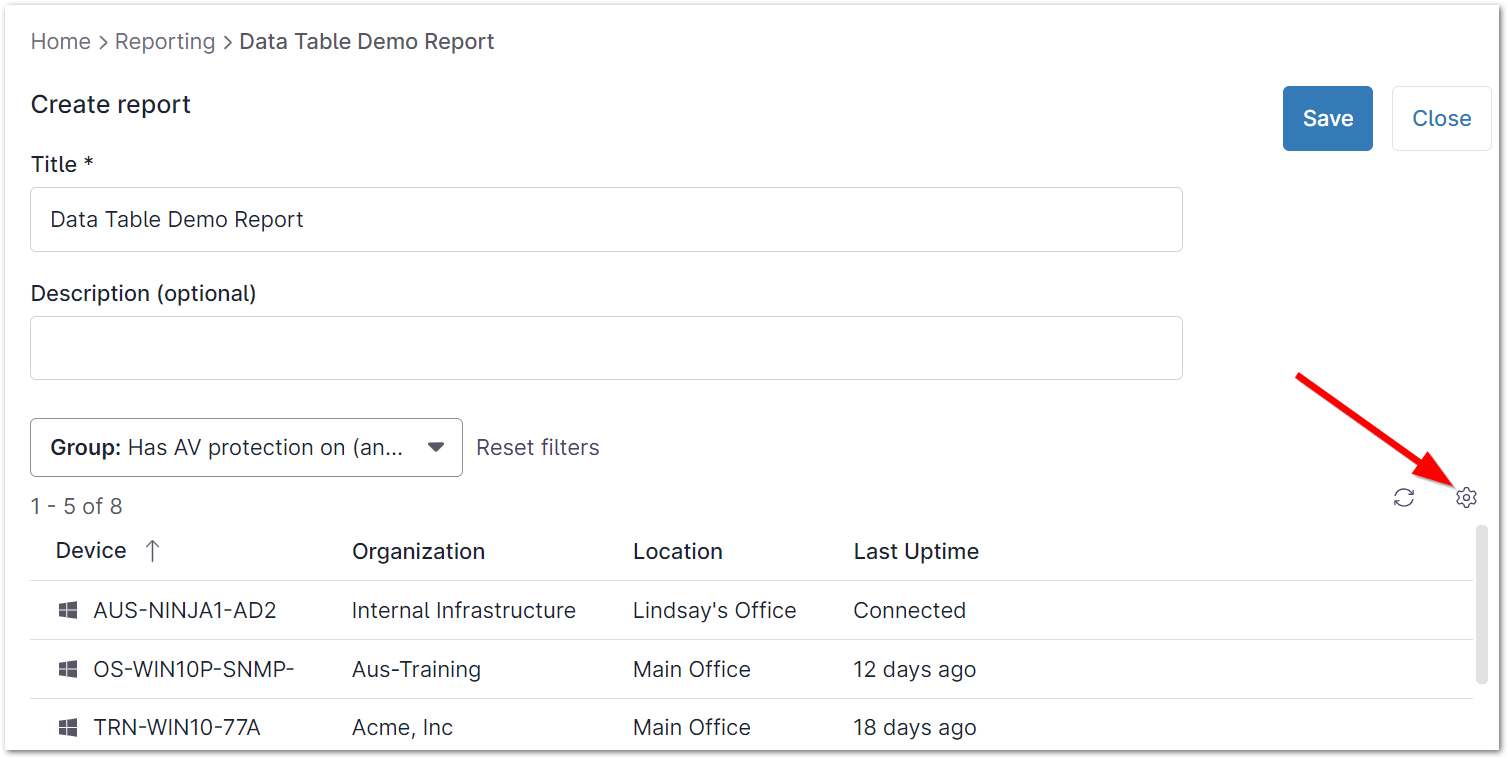
- Click Save in the top right to set the configured settings for the template.
- Click Close to view the dashboard for the report.
Runbooks
Refer to NinjaOne Runbook Reports for more information.
Viewing the Report Dashboard:
Navigate to Reporting and click the report name whose dashboard you would like to view. Please note that only summary and data table reports can be viewed from this dashboard; runbook reports will be sent to the creator's email. 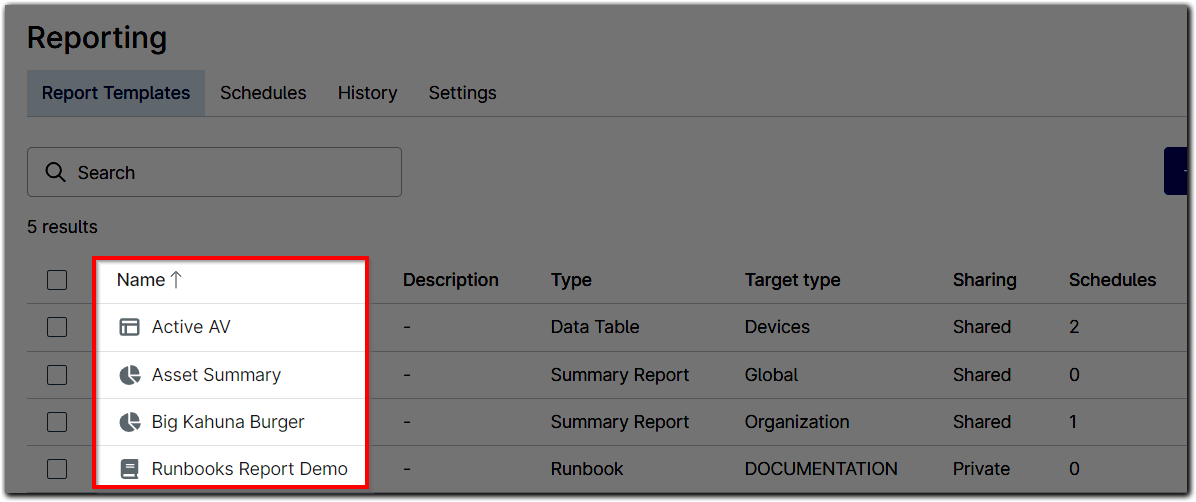
The report dashboard displays.
Report Dashboard Options
Data Table reports show only data for the group selected when the report was created, but different data sets can be viewed if the technician has "Edit" permissions for reports. If the device belongs to an organization that the technician does not have access to, the technician will either see no data for those organizations or see "insufficient permission" verbiage on the report page instead of field values. 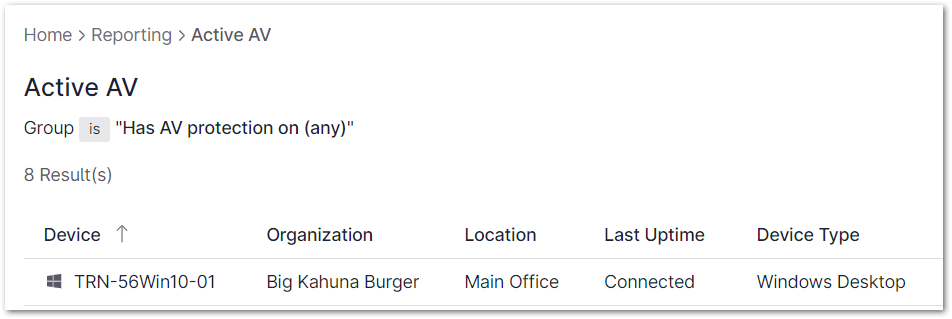
Organization reports provide drop-down menus at the top of the page to select the organization, location, device group and scope. Technicians can select organizations to which they have been given access in their account settings. 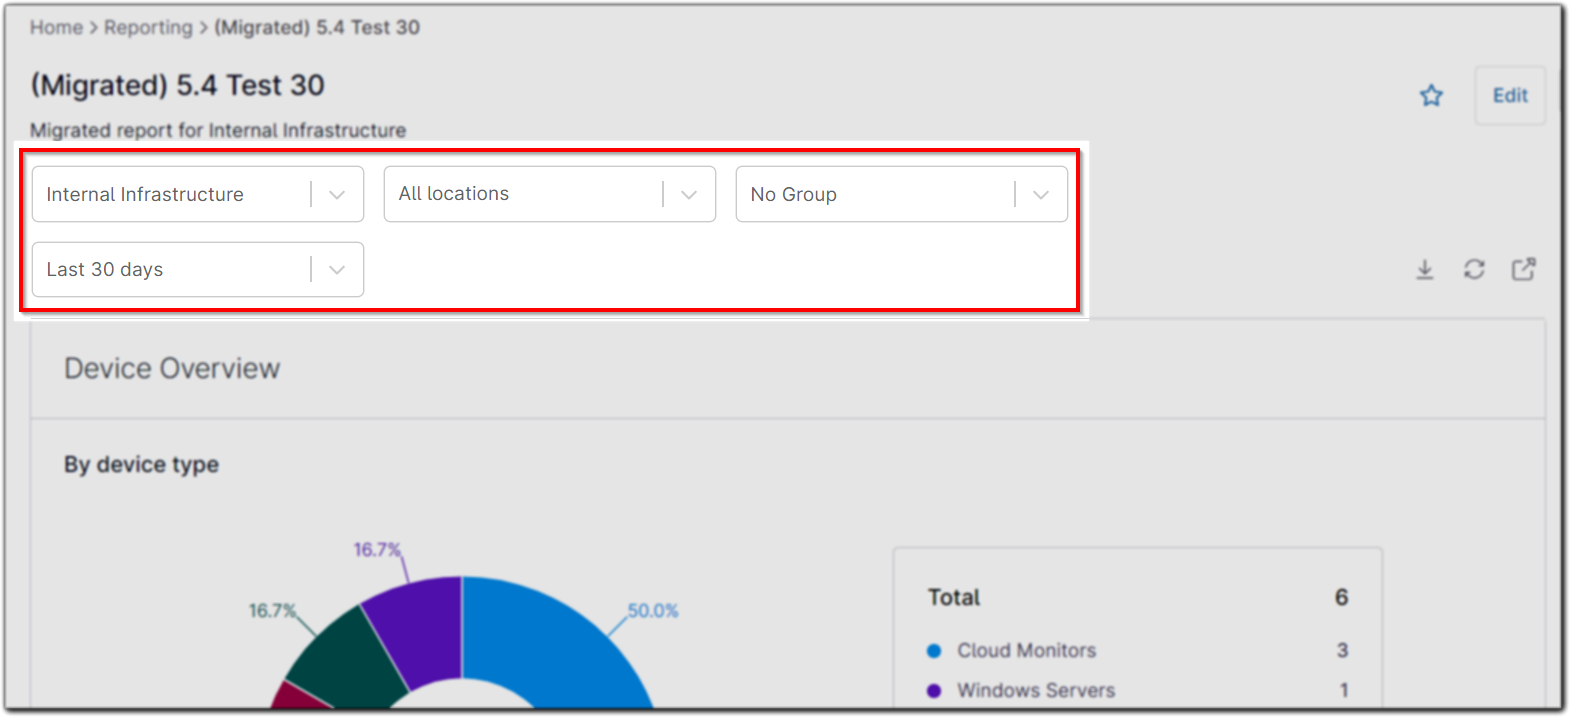
Global reports provide drop-down menus at the top of the page to select a group and the scope. If a technician does not have access to certain organizations, data from those organizations will be omitted from the global aggregates. 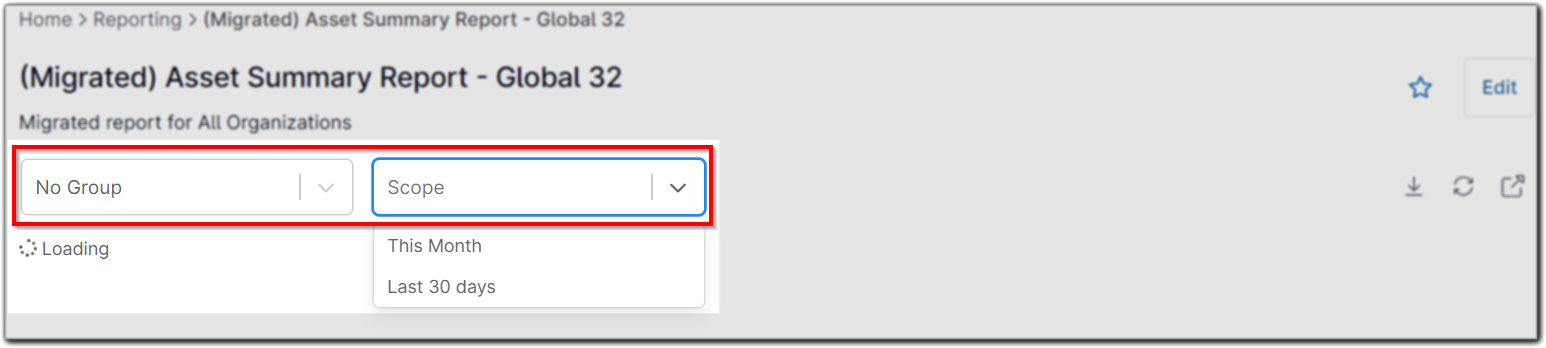
 | Saving the report also saves changes made to the filters, so you don't have to re-enter the same values upon re-opening the report. |
Dashboards provide the following action options:
| Option | Description/Action |
|---|---|
 | Save as favorite (under Favorites in the left navigation pane) |
| Edit report | |
| Download Summary Reports as PDF and Data Tables as CSV | |
| Refresh data | |
| Open report in new tab (not available for the Data Table report) |

Scheduling a Report:
System administrators and technicians with the appropriate permissions can set a schedule for reports to be distributed on a daily, weekly, and monthly basis. For more information, please see Scheduled Reports.
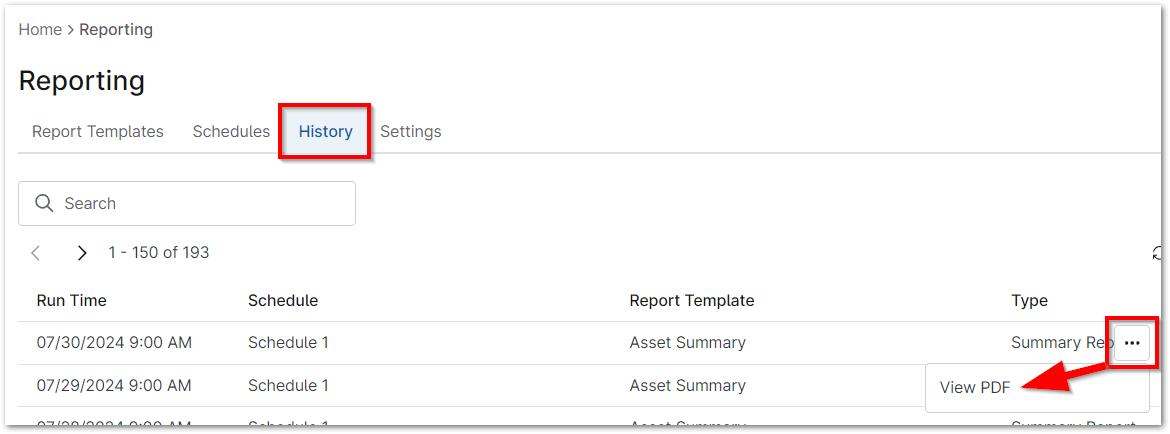
Viewing Report History:
- Click Reporting in the left side navigation pane and then open the History tab at the top of the page.
- Click the ellipsis icon on the right side of the table to view a PDF copy of that report.
Adding Your Own Logo to Your Reports:
From the Settings tab in NinjaOne Reporting, you can add a logo to reports and a cover sheet to scheduled summary reports.
- Click Reporting in the left side navigation pane and then open the Settings tab at the top of the page.
- Click Change on the right side of the page under Template settings and/or Exported cover page.

The Reporting Logo editor modal displays. Use the Choose File button to upload your logo and then click Save.
Important Note: The image must be a .jpeg, .png, or .gif file type. The largest dimensions accepted are 1000px wide by 500px tall with a maximum file size of 1mb.
Your branding displays in place of the NinjaOne logo in reports. Click Edit for Exported cover page and then Preview to see an example of what the finished report will look like.
Deleting Reports
To see how to delete a report schedule, refer to Managing Report Schedules. To delete a report:
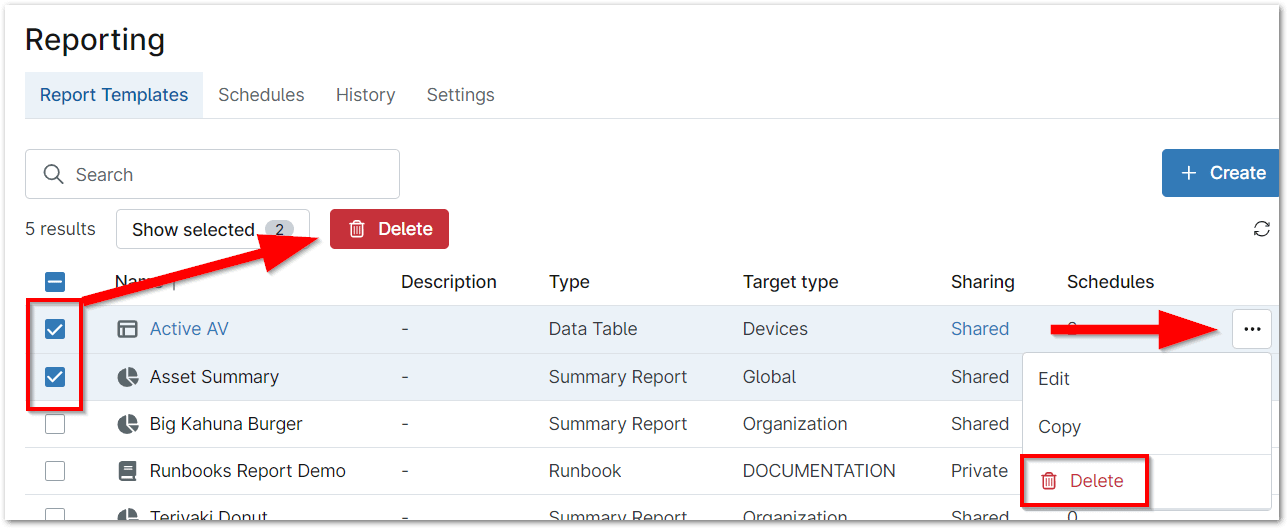
- Click Reporting in the left navigation pane.
- Click the ellipsis button to the far right of the report name and then select Delete.
- Alternatively, activate the checkbox for one or more reports and then click Delete at the top of the report list.