Topic
This article discusses the System and Organization Dashboards in NinjaOne.
Environment
NinjaOne Endpoint Management
Description
We are updating the system and organization dashboards in phases. During this time, you can participate in our design process and share your feedback. To share feedback, post in our RMM-feedback channel in Discord.
Select a category to learn more about the updated dashboard layout:
- Organizations
- Search Filters
- Actions
- Ticketing
- Device health summary
- Device health issues
- Incomplete documentation
- Running actions
- Recent system activities
- The Organization Dashboard
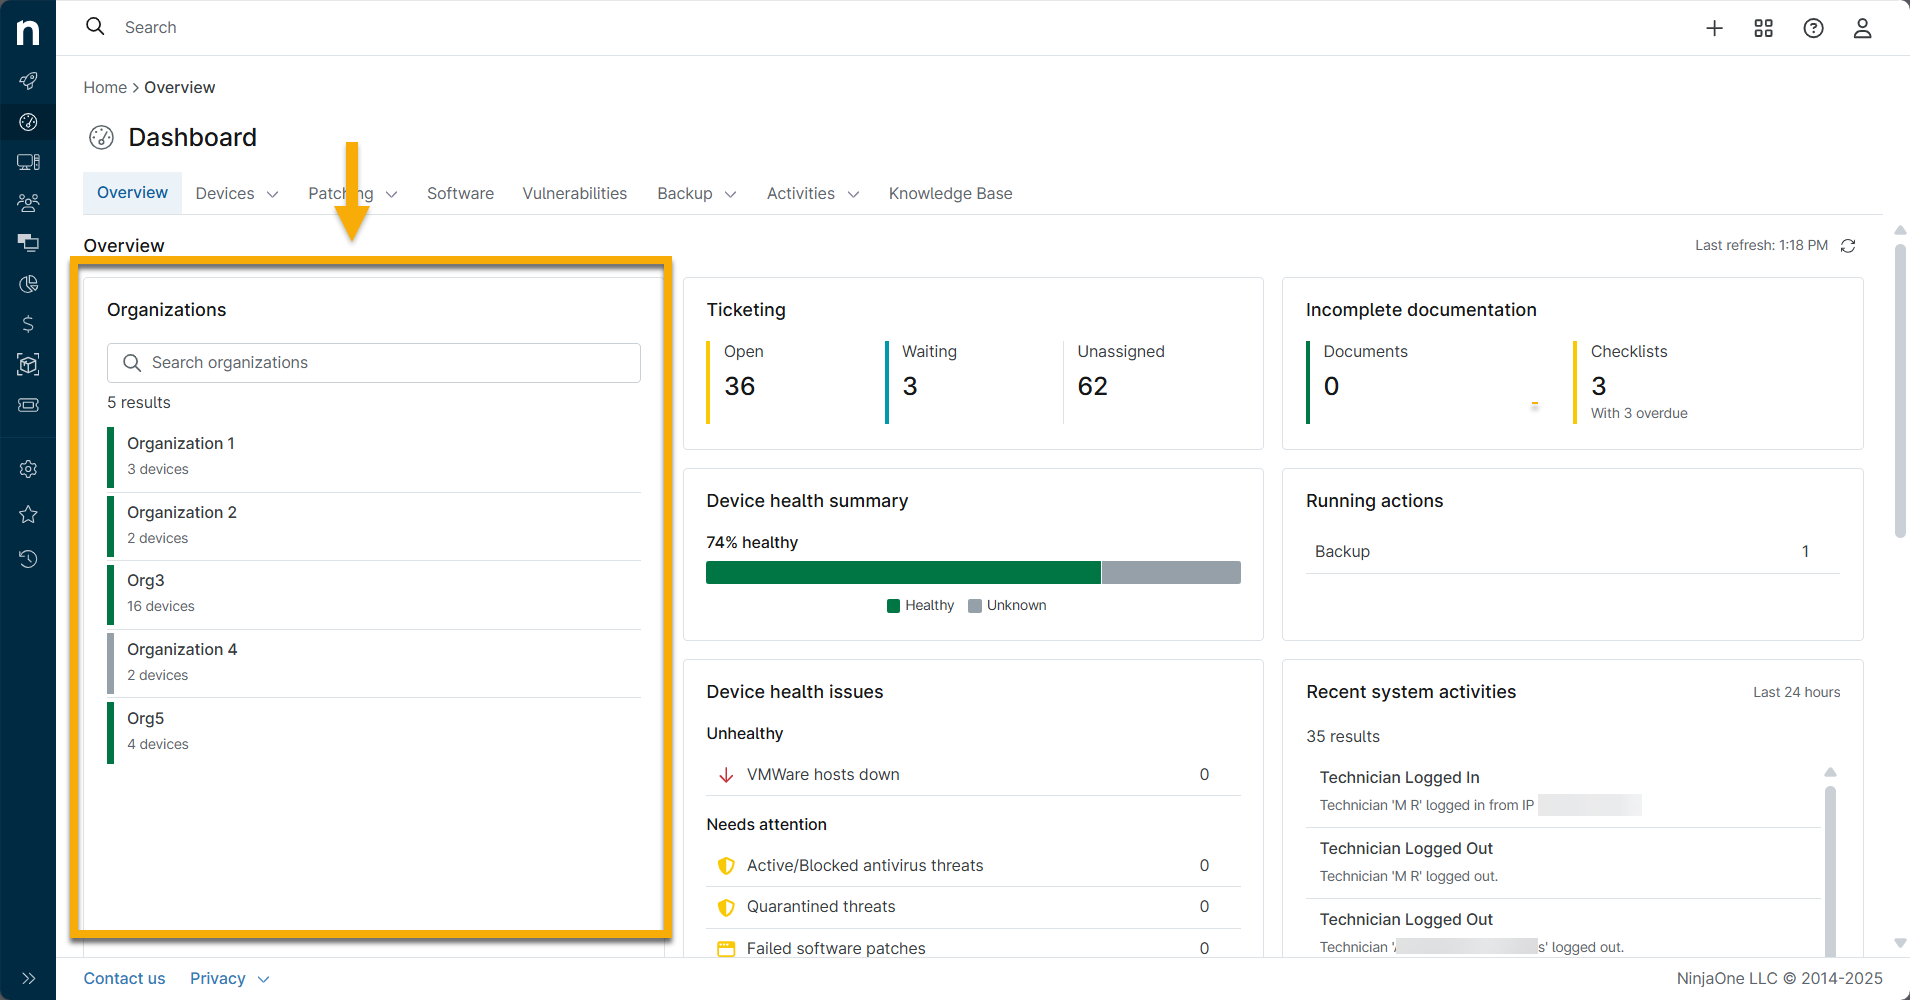
Organizations
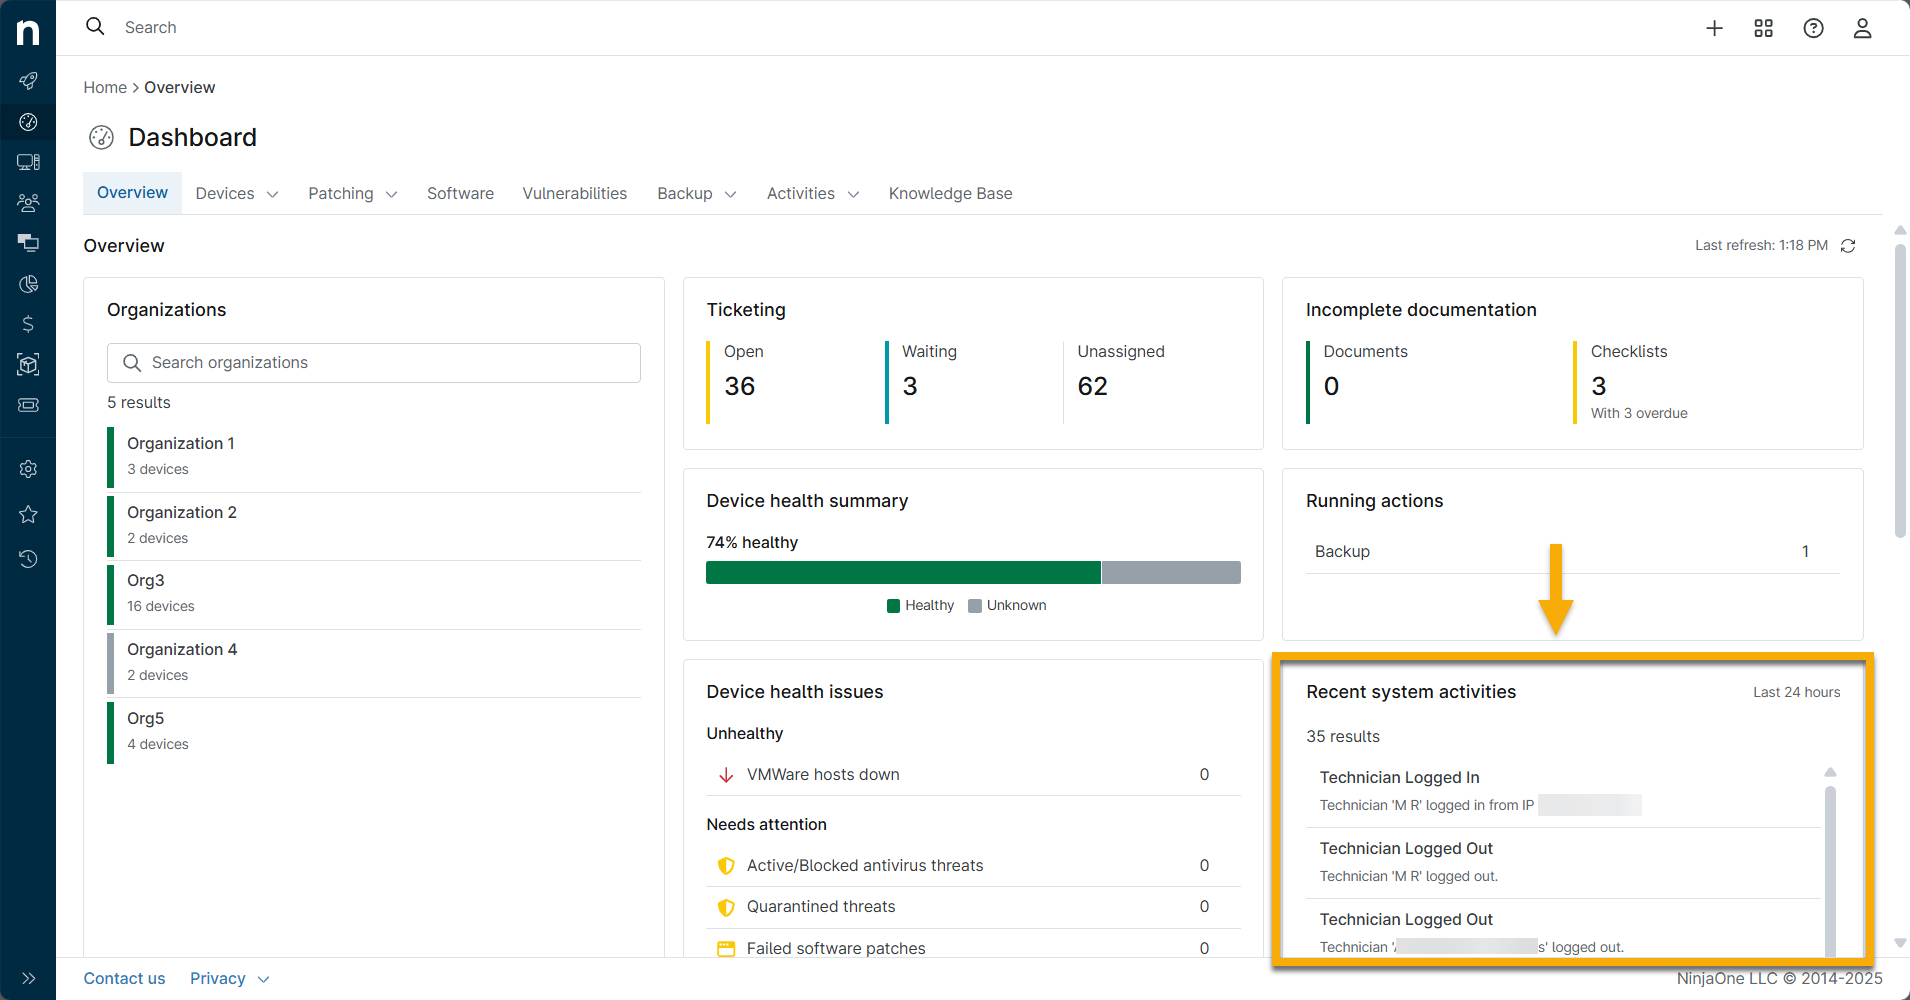
This widget displays all your organizations and the number of devices associated with each organization. It also displays actionable items for each organization (such as conditions triggered, patches pending, and threats detected).
The color codes for the displayed icons depend on the configured health status for each actionable item or event. For more information about this, and the default configurations for each item, refer to
Organizations Widget Menus
From the Organizations widget, you can:
- Navigate to the Organizations dashboard.
- Search for a specific organization.
- View and filter by health issues.
- Sort by health, devices, or name.
- Export data to a CSV file. Exported data includes:
- Device health status
- The organization name
- The number of devices for each organization
- The number of unhealthy devices
- The number of devices that require attention.
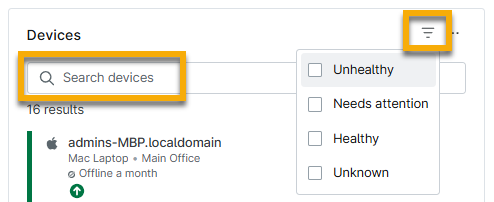
Search and Filter Organizations
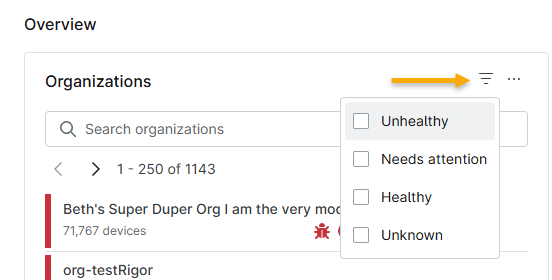
Place your cursor over the widget to view the search, filter, and ellipsis (three dots) icon.
- Search: Search for an organization by name.
- Filter: Filter devices by the following health status levels: Unhealthy, Healthy, Needs attention, or Unknown.
Edit Organizations Widget Settings
Customizing the Organizations widget
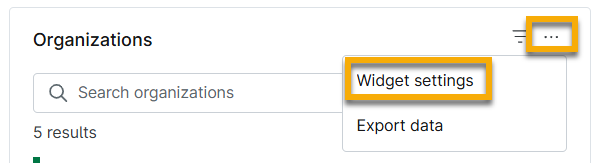
You can modify the Organizations widget by clicking the ellipsis icon and selecting Widget settings from the drop-down menu.
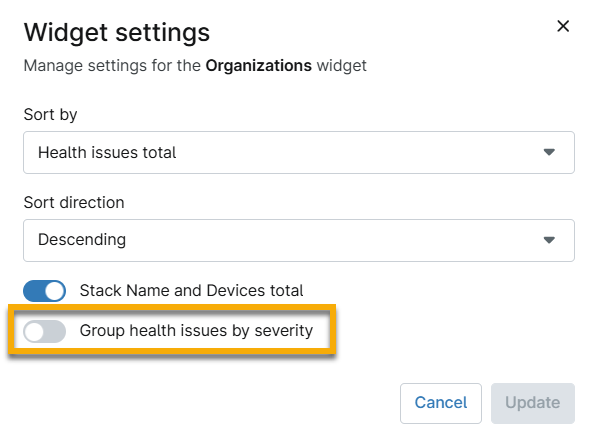
In the Widget Settings modal, you can customize widget sort data and sort direction, activate the Stack name and Devices Total, and group health issues by severity toggles.
Switching to the legacy UI
Toggling off Group health issues by severity in the Widget settings modal will revert the Organizations widget to the legacy UI. Turn the toggle switch back on to return to the latest UI settings.
Viewing Health Issue Alerts
Items that need attention within your organization will appear as warning icons next to the organization name. Place your cursor over the icon to learn more about the issue. Click the organization name to display its specific device health issues.
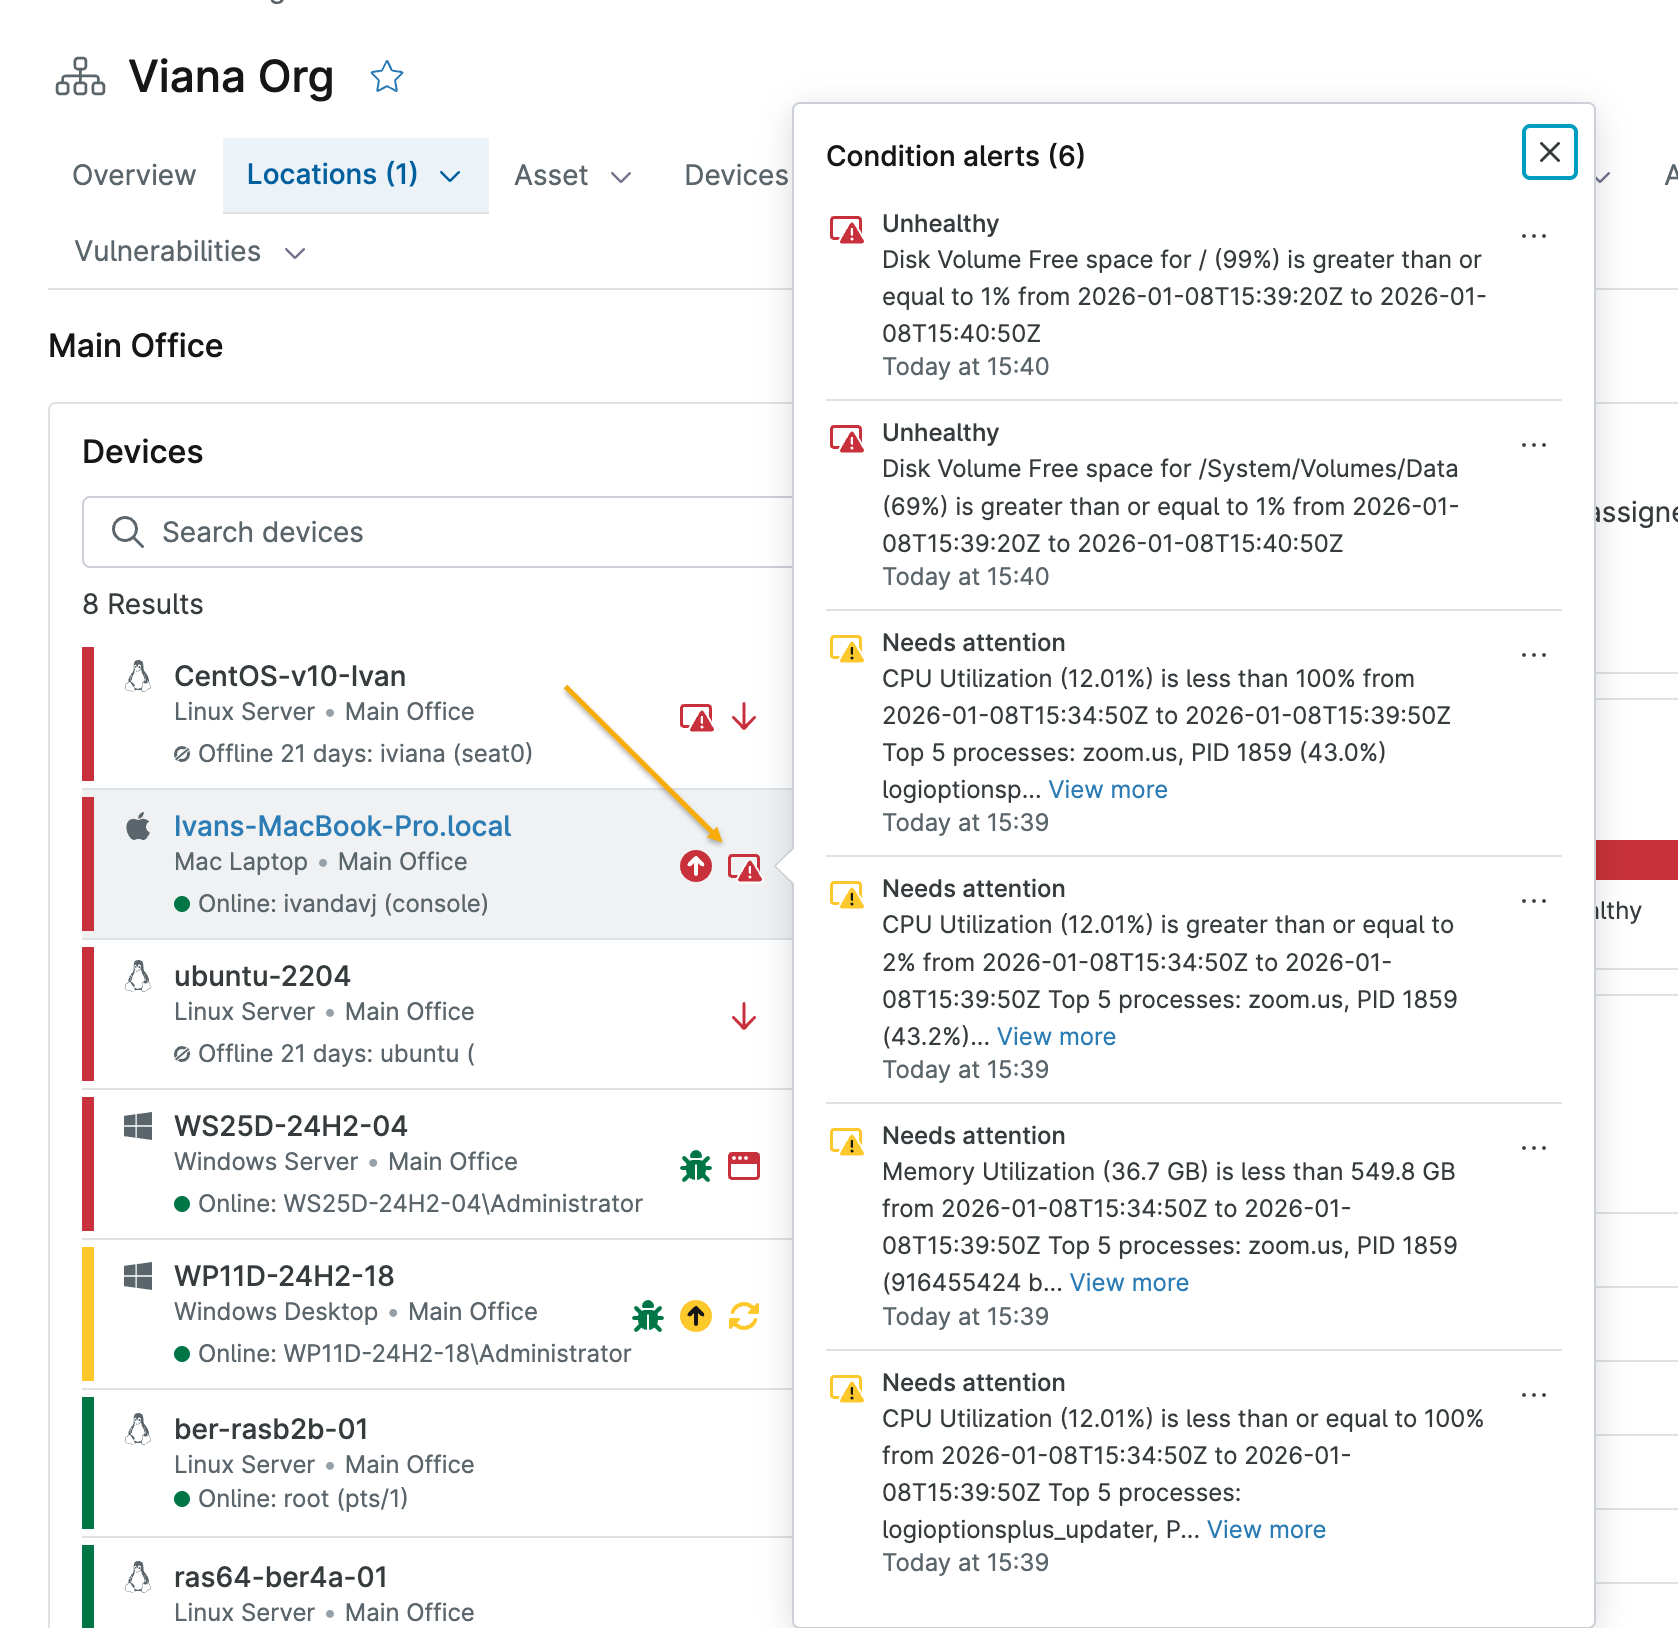
Viewing Condition Alerts
Click the Condition alerts icon to view any alerts triggered by conditions configured in the device's governing policy. NinjaOne will categorize these alerts by health status (either the global default or by the assigned custom health status). Refer to
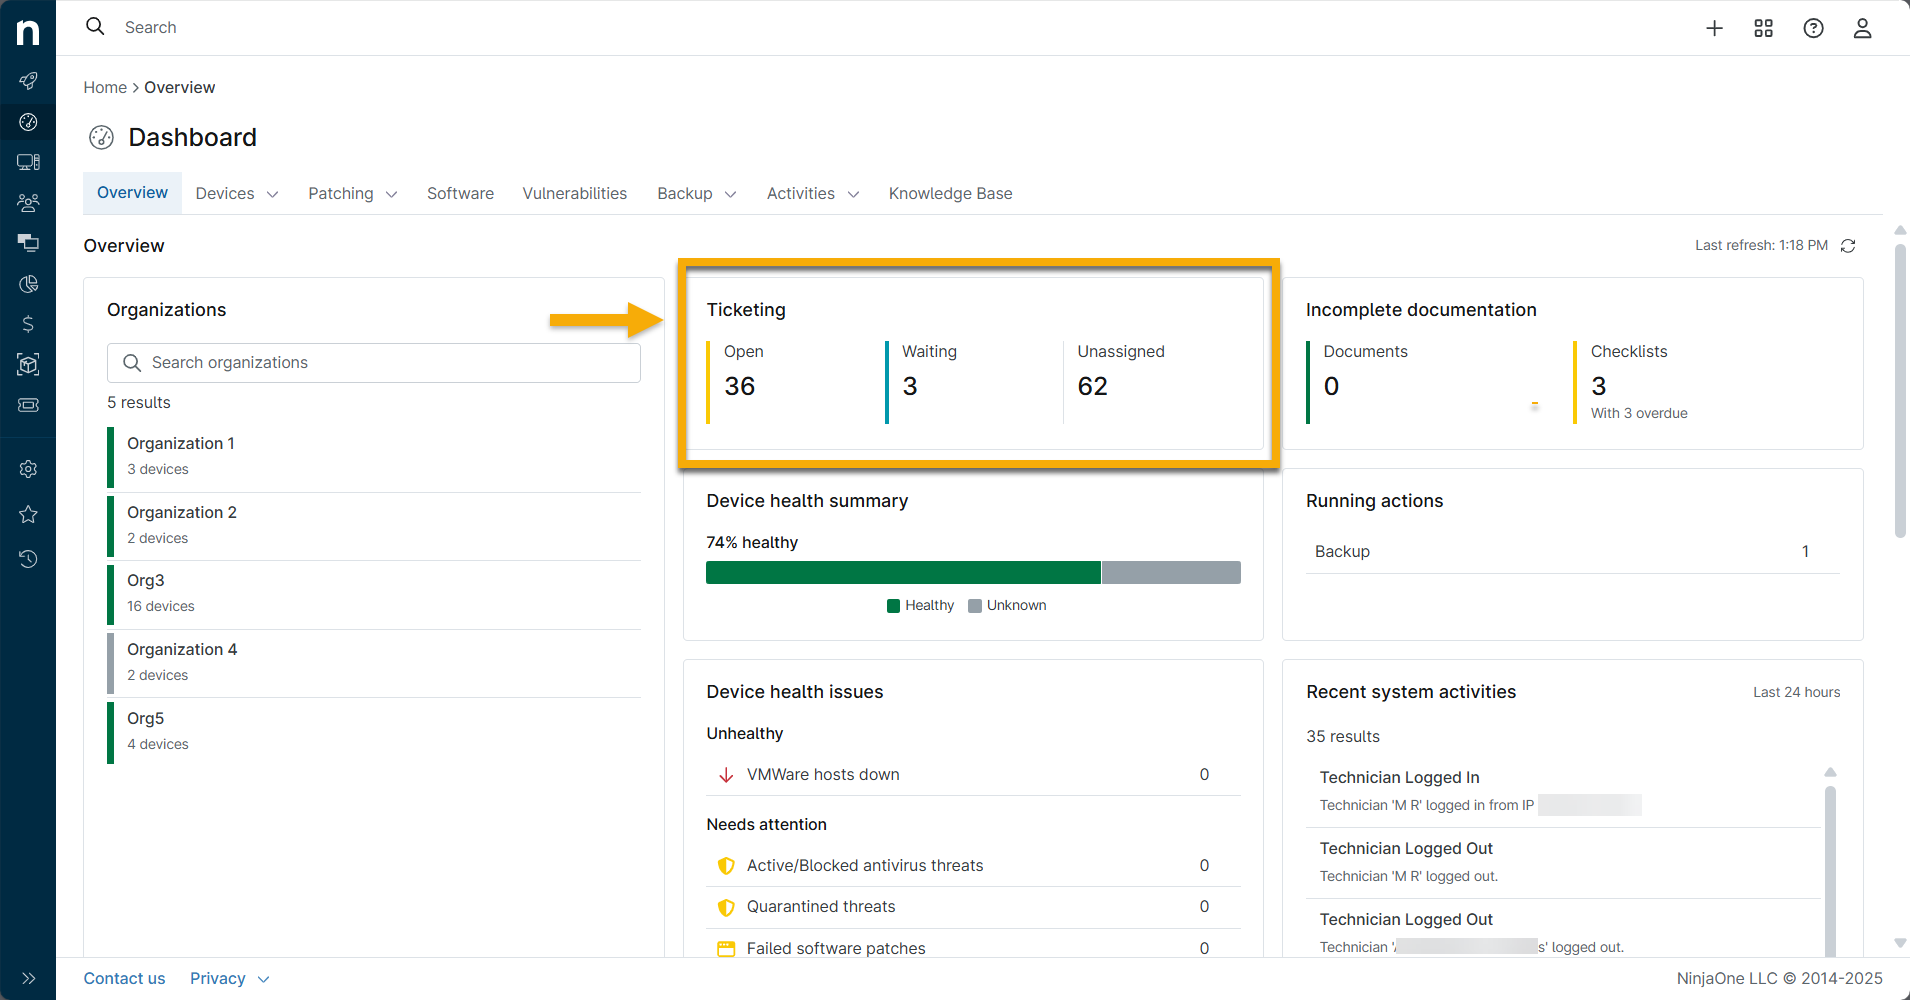
Ticketing
This widget does not show numbers for assigned, closed, or resolved tickets. Instead, it focuses on tickets that may require your attention or action. Click a section of the widget to navigate to the applicable ticketing board.
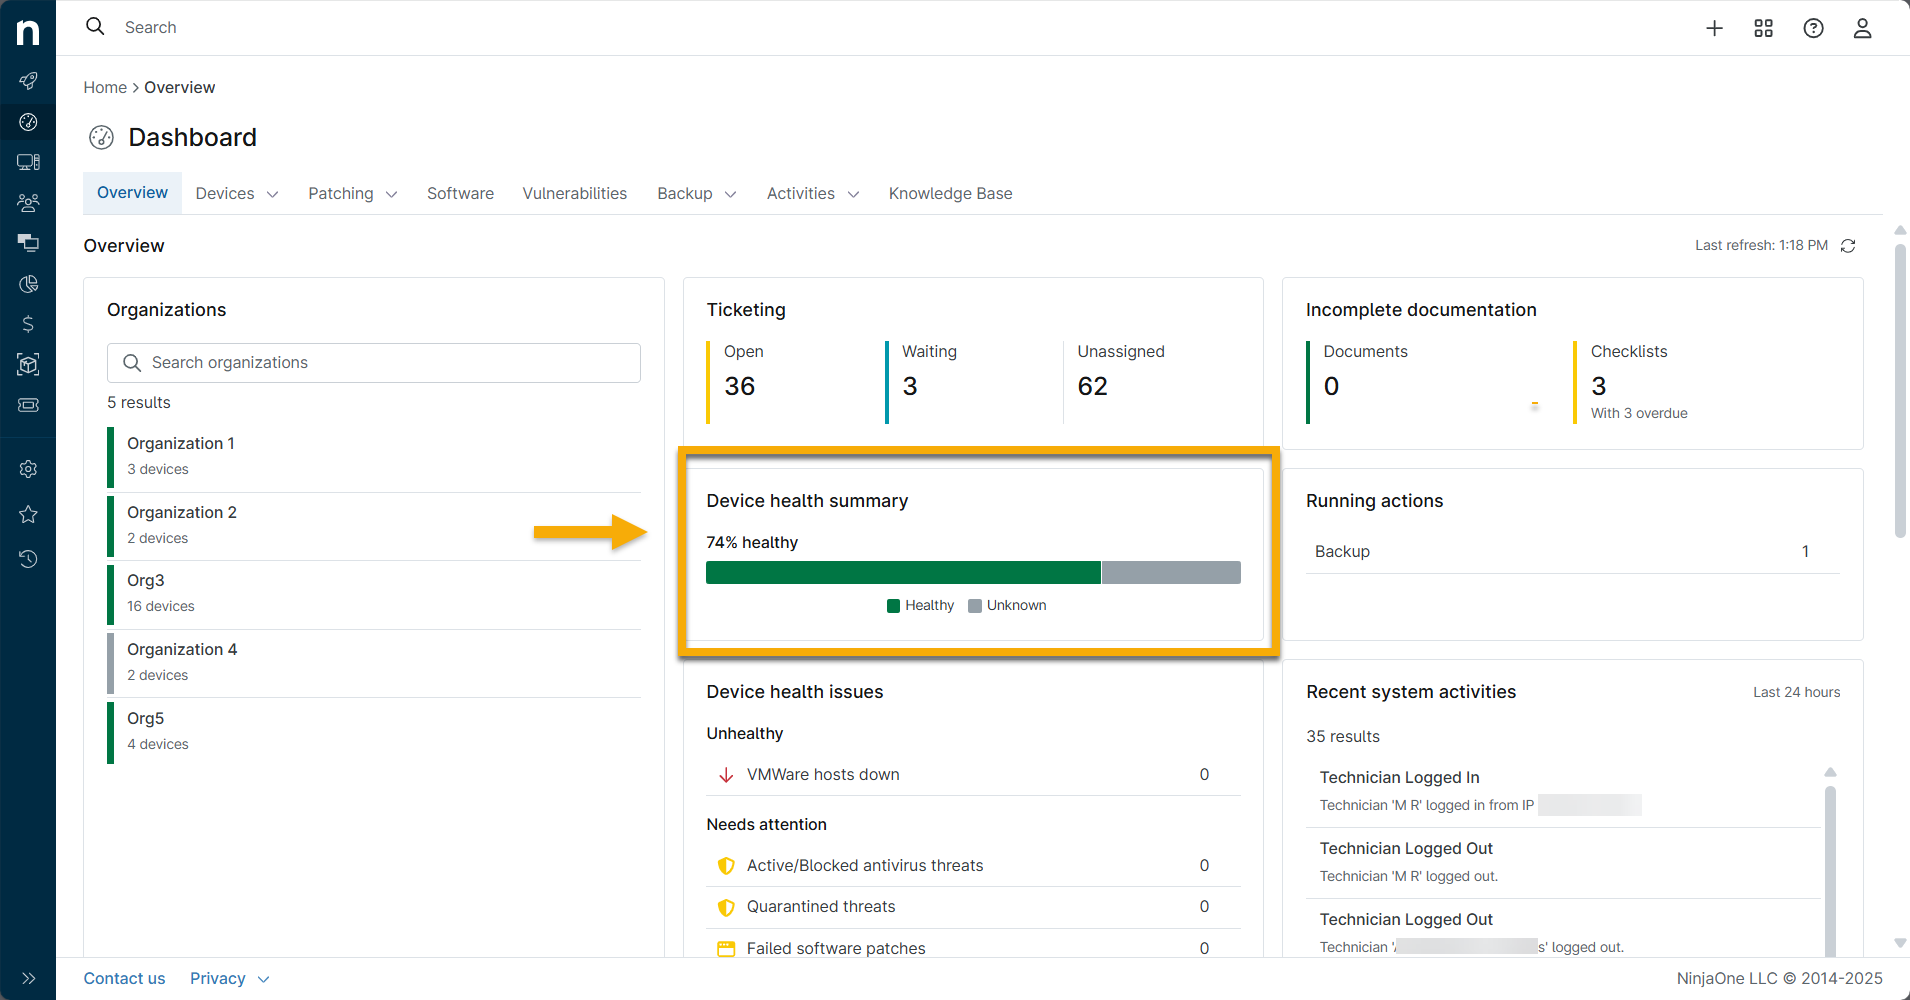
Device Health Summary
This widget displays a breakdown of overall health across all devices and organizations, represented as percentages. Place your cursor over the health status to view the percentage and number of devices affected. Click to navigate to the Devices search grid, which will be filtered by health detail. From there, you can take action on the device.
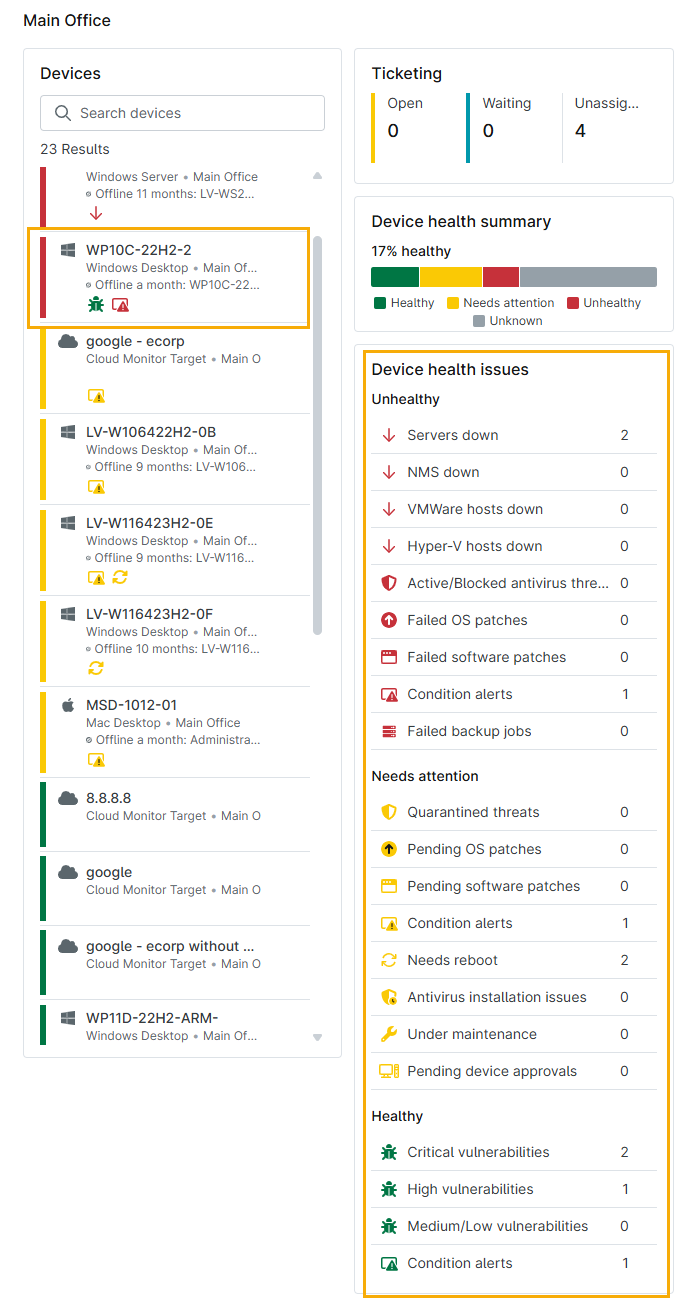
Device Health Issues
The Device health issues widget provides more details about potential issues affecting a device.
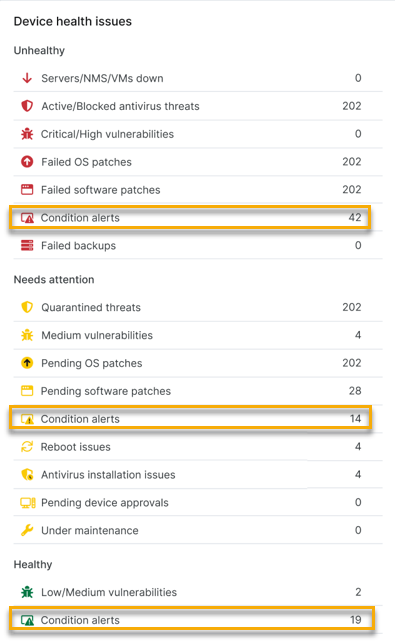
The Device health issues section shows the breakdown of issues in the following categories:
- Servers currently down
- Devices with active/blocked and quarantined threats
- Devices with failed and pending OS patches
- Devices with failed and pending software patches
- Devices with conditions triggered (both agent and cloud monitor-based)
- Devices with pending reboots and Bitdefender install issues.
- Pending and approved devices
- Hyper-V hosts down
- Devices with maintenance mode windows configured
- Devices with failed NinjaOne Backup jobs (if enabled)
- Devices with condition alerts
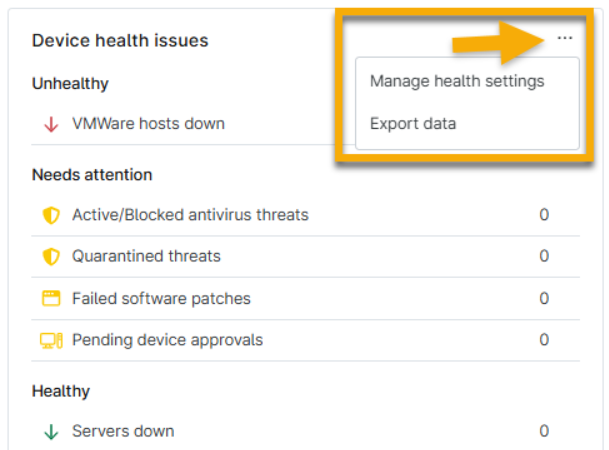
Place your cursor over the widget, then click the ellipsis (three dots) icon when it appears to manage health settings or export the data to a CSV file. Selecting Manage health settings will take you to Administration → Devices → Health status, where you can customize the status for each issue.
If the health status of a device is affected (indicated by the numbers in each row), NinjaOne will convert it into a hyperlink. Click the link to navigate to a filtered search page, where you can take action on the device.
Condition Alerts in the Device Health Issues Card
You can adjust the health state for conditions to accurately represent the severity and impact of device health status across NinjaOne. When triggered, these conditions display alerts in the Device health issues card. Refer to
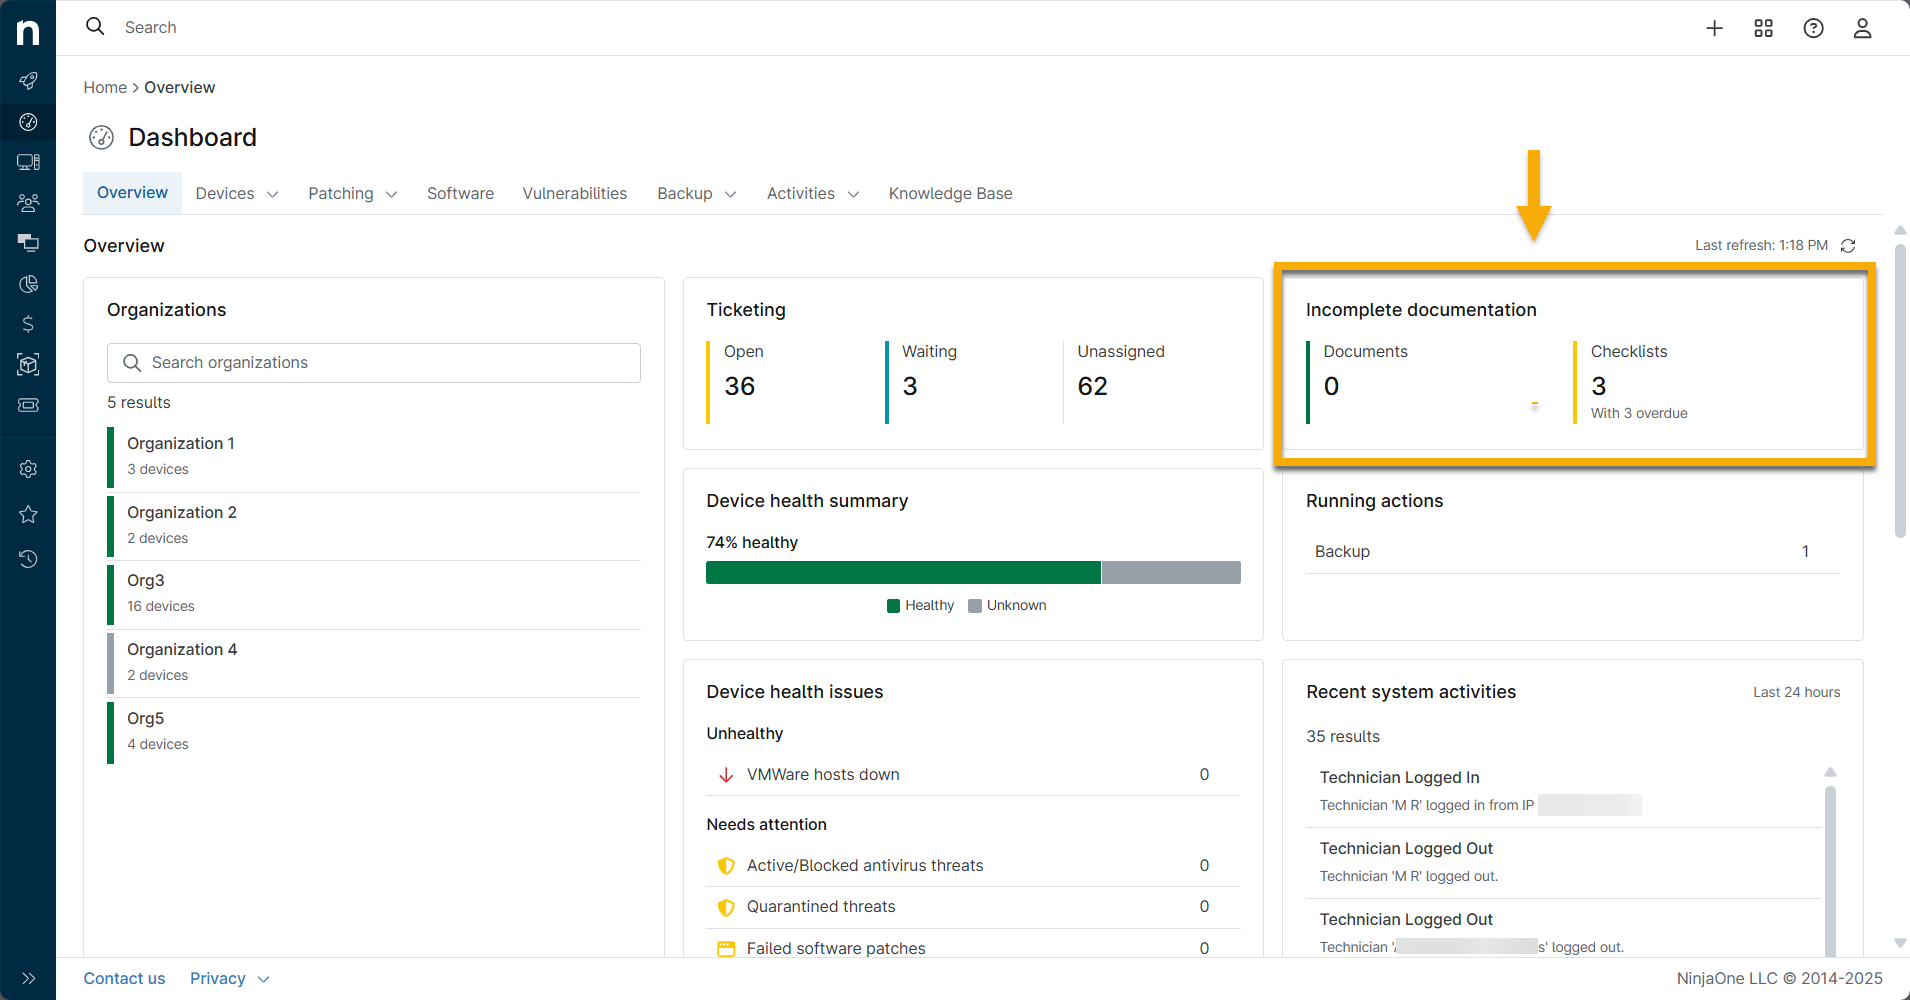
Incomplete Documentation
This widget shows the number of documents by status. It does not show numbers for unassigned or optional documentation; instead, it focuses on those that may require your attention or need action.
Click the Documents or Checklists section of the widget to view a modal that displays a list of all organizations, including the number required and those that or overdue.
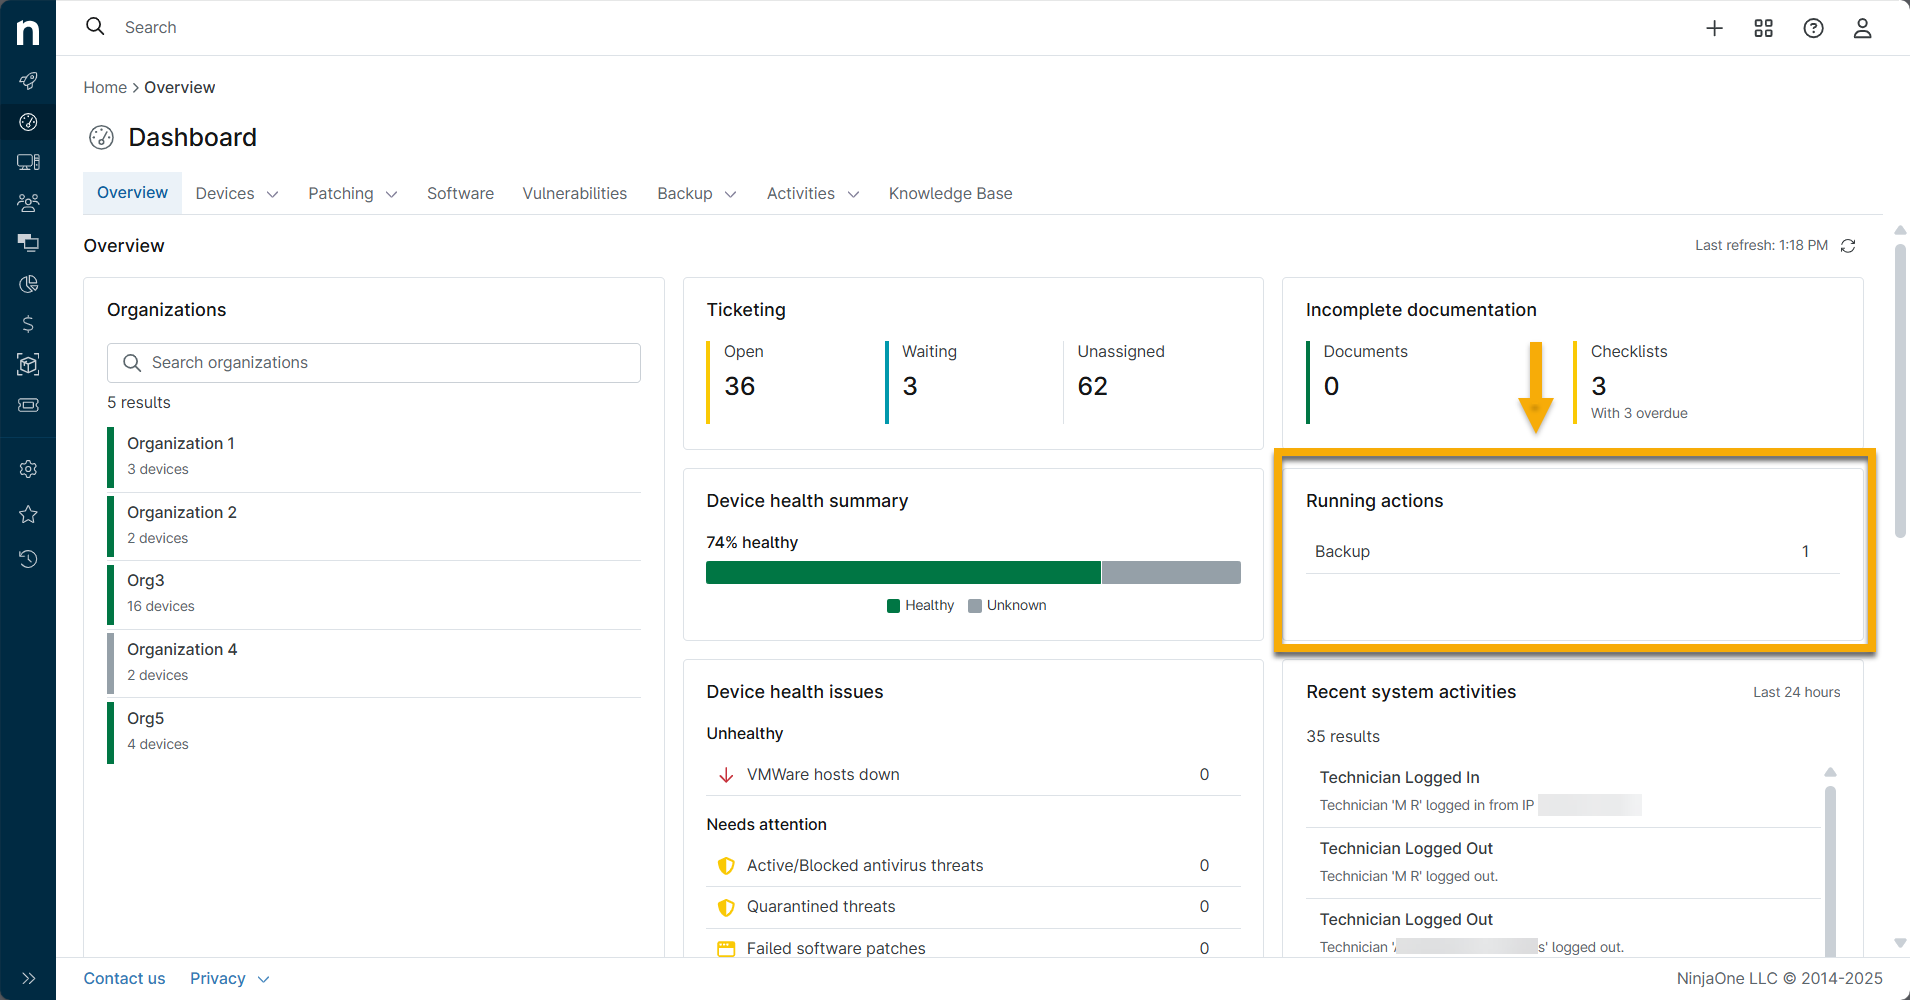
Running Actions
This widget shows all the active jobs in the system. You can click each action in this widget to view a list of devices running that action; the number next to the action indicates the number of devices affected.
The running action or job can be any of the following tasks in progress:
- Scheduled and on-demand actions
- Antivirus scans
- Patch management scans (OS or software)
- TeamViewer sessions
- NinjaOne Backup jobs
Recent System Activities
The Recent system activities widget shows any instances of:
- Devices registered, updated, or removed.
- Users logged in or out (click the name to navigate to their account configuration page).
- Devices migrating between organizations.
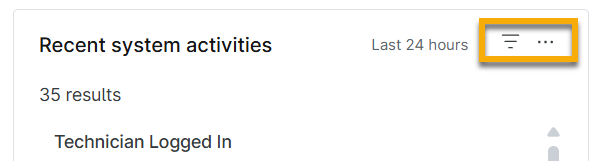
Move your cursor over the widget to view the filter and ellipsis icons. Here, you can perform the following actions:
- Filter by: 24 hours, 7 days, or 30 days
- Ellipsis: Navigate to the Activities tab or export the data to a CSV file
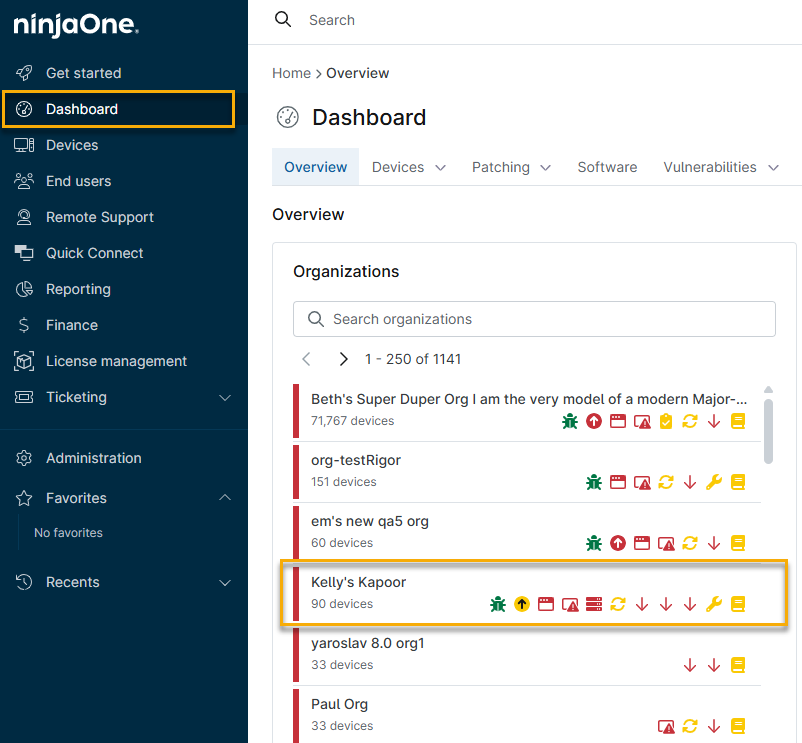
The Organization Dashboard
In the NinjaOne dashboard, click an organization to access its specific dashboard.
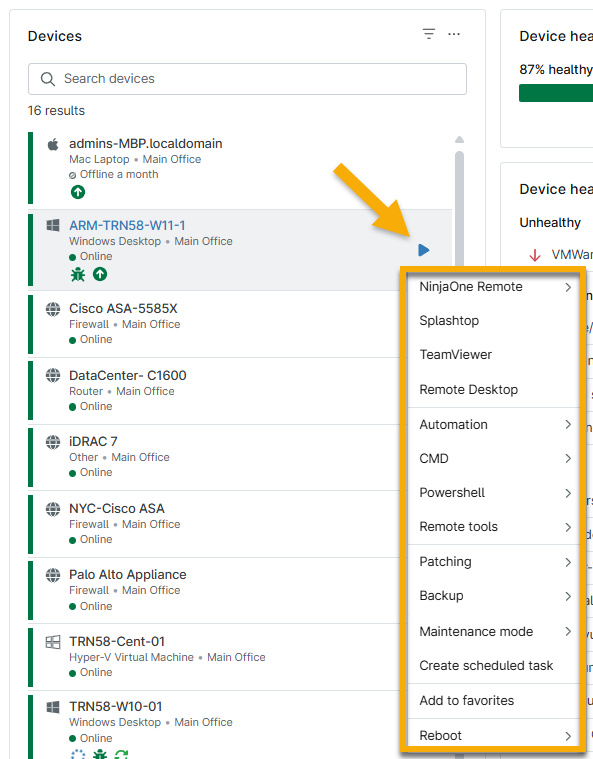
The Organization dashboard lists the devices within the organization. From here, you have the following options:
Perform Device Actions
Move your cursor over the device information arrow to view eligible actions. These actions depend on device type, settings, and enabled features.
Filter Devices by Health Status
Click the funnel icon to filter devices by their health status.
Change Widget Settings and Manage Devices
Click the ellipsis icon. The Actions drop-down menu enables you to edit the Devices widget and manage device options.
- Widget settings: Sort the widget by health status, device name, or operating system.
- Manage devices: View the devices managed by this organization on the Devices search page, where you can perform additional actions. Refer to Find and Manage Endpoints from the Devices Search Page for instructions on using this page.
Recent Device Activities
Where the system dashboard showed recent system activities, the Organizations dashboard shows recent device activities. By default, the widget displays the activity from the last 24 hours.
- Click the funnel icon to select a new date range for activities.
- Click the ellipsis icon to navigate to the Activities dashboard or export the recent activity data.
Additional Resources
Refer to the following resources to learn more about dashboards in NinjaOne:
- End Users Dashboard
- Dashboards: NinjaOne Backup
- Backup: Deletes Dashboard
- NinjaOne Dashboard: Device Details
- NinjaOne Dashboards: Patch Management
- Dashboards: Patching Software Inventory
- NinjaOne Ticketing: Device and Organization Dashboards
- Manage Devices and Run Actions from the Device Dashboard
- NinjaOne NMS: Device Dashboard Navigation and Management
- NinjaOne Dashboards: Assets