Topic
This article explains how to use the Devices search page to locate managed devices and run actions on them.
Environment
NinjaOne Platform
Description
You can access the Devices search page from the sidebar menu in NinjaOne. This page allows you to find devices by filtering by their organization, location, operating system, role, health status, and more.
- Where to Find the Devices Search Page
- Features and Table Settings
- Changing and Adding Columns
- Running Actions on Devices
- Additional Resources
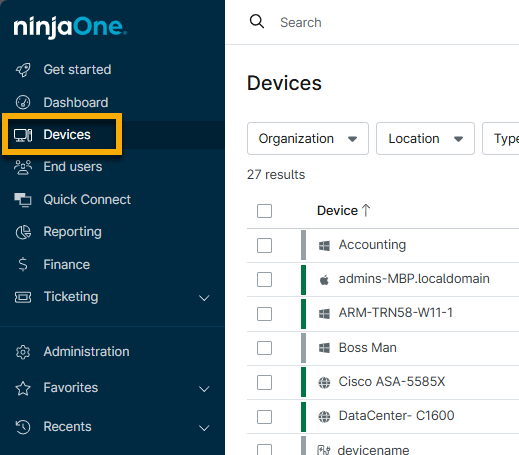
Where to Find the Devices Search Page
Click Devices in the NinjaOne sidebar menu.
The data in most of the default columns is clickable and will direct you to different locations or take actions. For example:
- Device: Navigate to the device dashboard.
- Health Detail: View information and take action.
- Organization: Navigate to the organization dashboard.
- Location: Navigate to the Location tab within the organization dashboard.
Features and Table Settings
The following sections explain different tools and settings on the Devices search page.
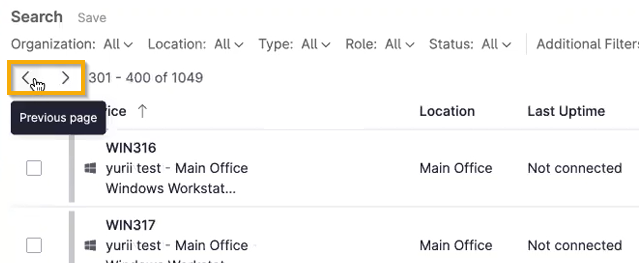
Pagination
If you have 150 or more devices in NinjaOne, the list of devices will be split into pages, and arrows will display at the top of the list. Use the < > arrows to view additional devices; each page displays up to 150 devices.
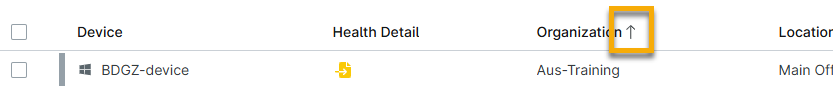
Column Management
Columns that can be sorted will show an arrow in the header when you move your mouse cursor over the column name. Click the arrow to change the order from ascending to descending.
Click the Table settings icon to add or remove columns from the board and change the order in which they display. For more information about this tool, refer to the section of this article titled Changing and Adding Columns.

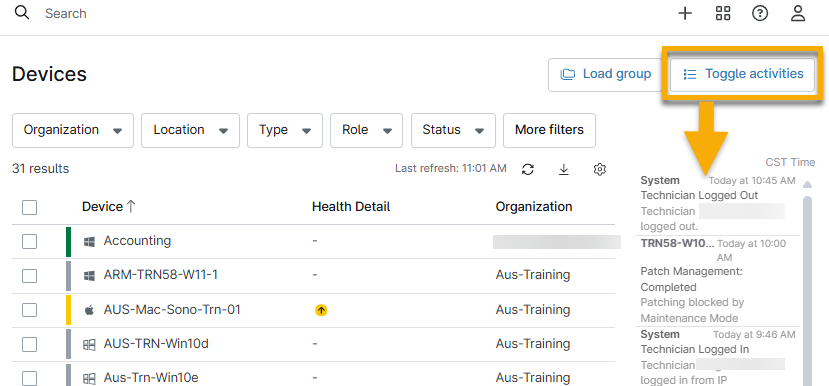
Toggle Activities
The Activities log is hidden by default; click Toggle Activities to display the data.
Health Detail
The Health Detail column shows health status icons; move your cursor over the icon to see details.
Click the icon to see if you can take action on the device. For more information about running actions on devices, refer to the section of this article titled Running Actions on Devices.
Load Group
Groups will filter the table to show data for a selected device group. NinjaOne has several built-in search groups that you can view by clicking this button. Select a group to apply it to the Devices search page.
To learn how to create custom groups, refer to our
Search Filters

After you interact with the search filters, additional options appear:
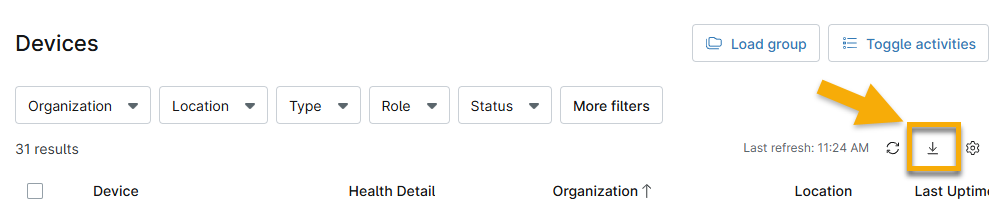
Export Search Data
When exporting the data from the page to a CSV spreadsheet, you have three options:
- Export visible columns: This option exports all column data currently visible in the table. You can add or remove columns for the exported data; refer to the Changing and Adding Columns section of this article to learn more.
- Export with all device details: This option will include all column details, regardless of what is showing on the page in NinjaOne. This export does not include custom fields.
- The NinjaOne agent manages the device roles for Microsoft Windows, Apple macOS, and Linux. When exporting CSV data from the Devices search page (export with all device details), the Type column will show AGENT for unmanaged devices since they support the agent installation.
- Export with custom fields: Export a spreadsheet containing device ID, name, role, type, organization, location, tags, and all custom fields with their last update data.
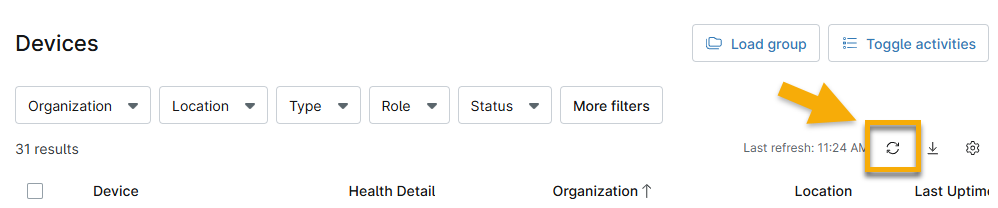
Refresh data
Click the refresh icon to keep data up to date. This button updates any data affected in real time, such as a new health condition or the last uptime.
Changing and Adding Columns
The Devices search page displays certain information by default, but users can customize it to meet their data and reporting needs. Column customization includes adding and filtering custom fields, which can be exported with device data into a spreadsheet.
These settings save to the local storage, meaning changes persist even after the user logs out and logs back in on the same computer or browser.
To customize the dashboard, perform the following steps:
- Click the gear icon (
 ) in the top right corner of the page. The Table settings configuration dialog displays.
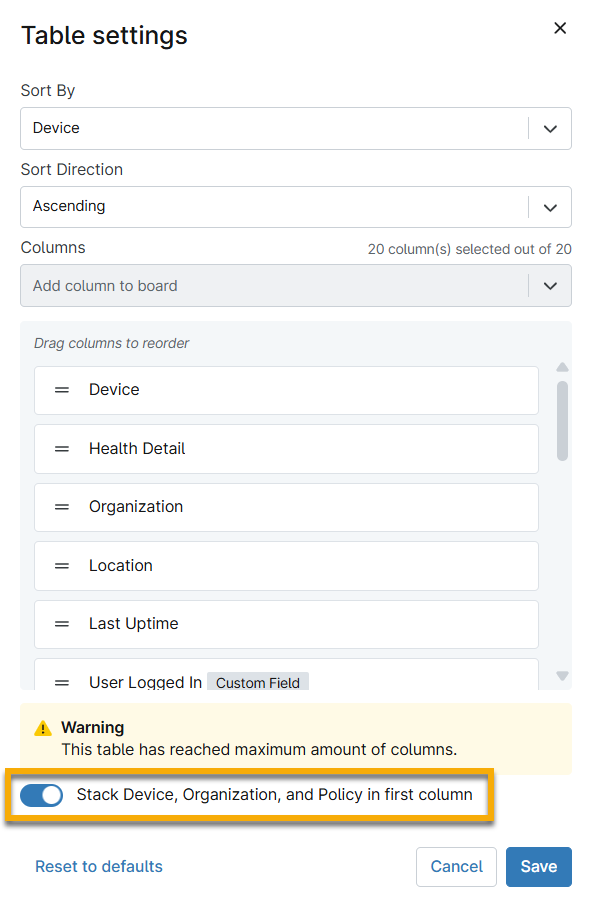
 - Make any necessary changes to the sort order and use the Columns field to add more data columns to the table. Click into the field to view all options or begin typing the column's name and select the applicable option from the auto-complete suggestions.
- To change the display order of the columns, click and hold the column title and drag it up or down to change the layout.
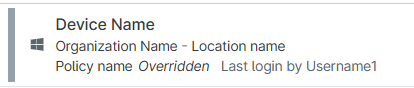
- Select the Stacked toggle to condense the organization, location, and policy into the same column as the device name.
- Click Save.
Adding Software Columns to the Device Search Page
Users can add up to five software columns to the Devices search page from the Table settings configuration dialog.
- Click the Table settings gear icon.
- Click the Columns drop-down menu, and then select Software.
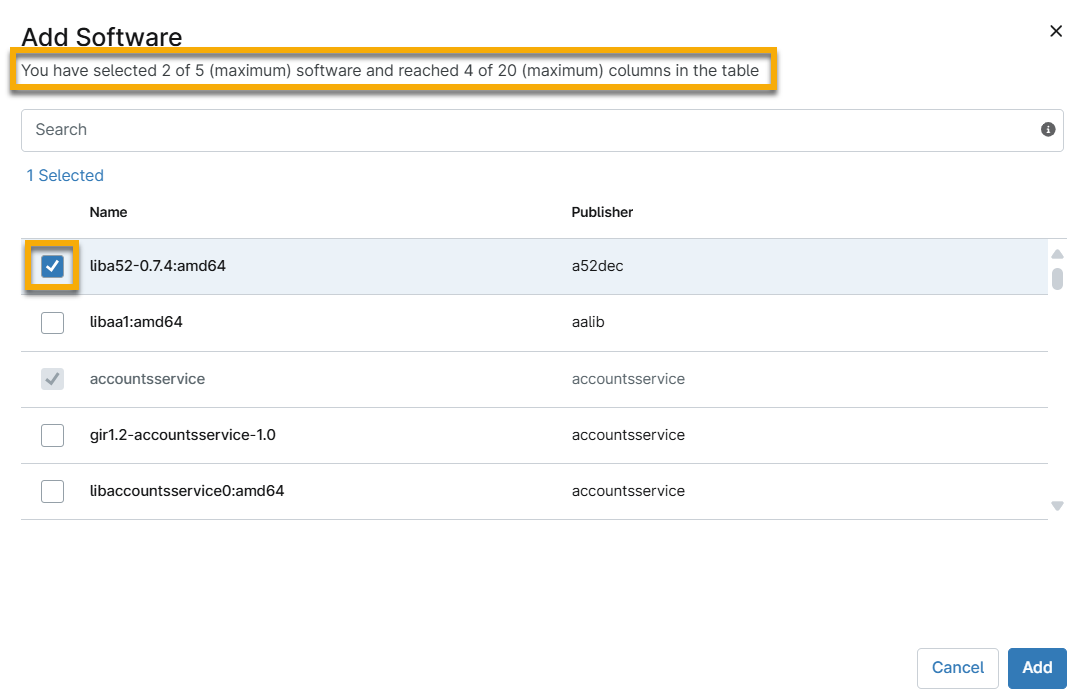
- Select the checkbox next to the software name to add it as a column on the search page. You can select a maximum of five software, and it must not exceed the required maximum of 20 columns in the table. The text below the Add Software dialog title will inform you of the current number of columns selected.
Software you previously added to the search page will appear greyed out in the search results.
- Click Add.
- Users cannot use the software columns to sort the table.
- Software tooltips indicate when multiple versions of software are present on a device. The search row value will present the version and a tooltip that displays the versions and publishers.
- When selecting column options from the drop-down menu, optional columns will no longer have checkboxes; users can click anywhere on the row to select.
- Text over software in the data table displays the vendor or publisher name of that software (for example, Google Chrome will show as Google, Inc.).
Running Actions on Devices
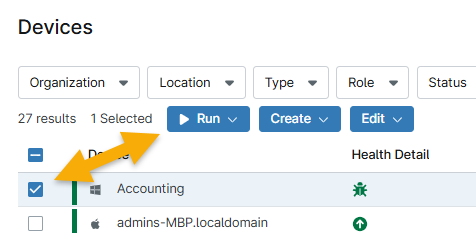
Depending on permissions and the device's status (it may need to be turned on or connected to the NinjaOne agent), you can perform actions on the device by selecting the checkbox to the left of the device name and using any of the qualified options that display at the top of the table.
The actions you see at the top of the device list depend on several factors, such as:
- Whether you activate the integration, application, patching, or other features at the policy level
- What policy is managing the device
- Select devices of the same type to change the policy for multiple devices
- Device health status
- Device uptime status
- Device type
- You must run scripts and specific ad hoc actions on devices of the same device type.
- The Run option will not display if you select devices of different types.
- The selected devices must be of the same type to change the role for multiple devices.
Common Action Descriptions
When running a script on an offline device, the script will be queued to run on the next check-in. You can cancel queued scripts.
When running a custom script, NinjaOne will prompt you to specify any parameters (optional) and whether you wish to run the script as System, the current user, or using credentials from your credential store.
| Action | Description |
|---|---|
| Run | Run a product (remote, patching, or backup tools), automation, start maintenance mode, enable Wake-On-LAN, or reboot the device. When running an automation, you will choose from a list of actions or scripts to run on the devices. This option is similar to the action button found on the device dashboard. |
| Create | Create a scheduled task or ticket for the selected devices. Refer to NinjaOne Ticketing: Resource Catalog to learn more about NinjaOne Ticketing. |
| Edit | Update the device's policy, organization or location, device role, assigned user, tags, or asset status. You can also use this option to enable backup or delete the device. Refer to NinjaOne Endpoint Management: Delete or Remove a Device for more information about the different removal options. |
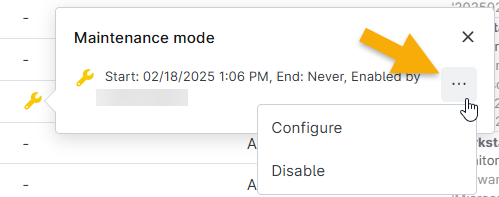
Maintenance Mode for All Devices
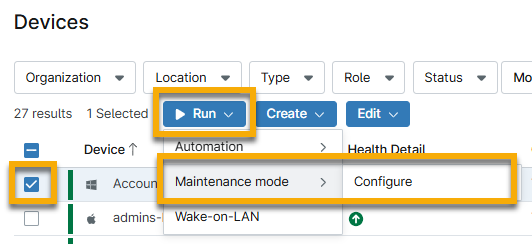
Selecting a checkbox for a single or multiple devices of the same type or policy provides action items. If you select devices with different types or policies, these actions are limited to Run → Maintenance. From here, you can start maintenance mode immediately or set it to run and end at a specific time.
Maintenance mode is intended to suppress notifications and other selected features for devices. Refer to
Additional Resources
Refer to the following resources to learn more about device management in NinjaOne: