Topic
This article explains how to use the Details tab on the NinjaOne device dashboard.
Environment
NinjaOne Endpoint Management
Description
The Details tab on the device dashboard allows you to view various device identification information and hardware specifications from a single page in NinjaOne. This article describes its different sections and the data you can expect to see in them.
Accessing device details
Access the device dashboard from the organization dashboard or the Devices search page, then click Details on the top navigation menu.
Selecting device information categories
Your device type (monitor, laptop, VM, or others) determines the information type in the Details tab. Select a category from the Device Information Categories list below to review a description of the information and its availability per device type:
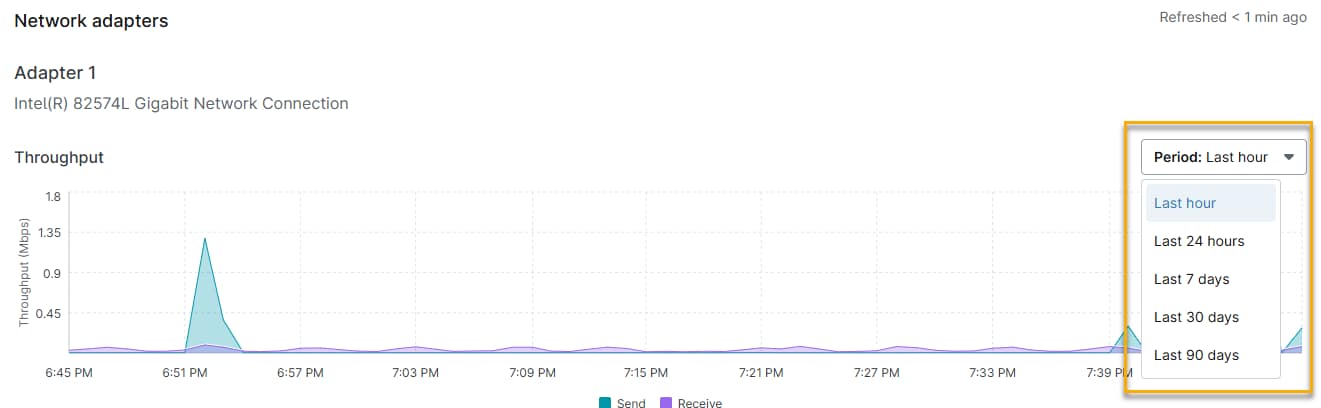
Long-Term Device Performance Graphs
Multiple device detail sections, including CPU, Memory, Disk Usage, Disk Transfer Rate, Disk Active Time, and Network Usage Data Points, now let you view data over a time range from the last hour to the last 90 days, for more comprehensive monitoring and troubleshooting.
Use trend data to determine hardware replacement planning and report on long-term performance.
Device Information Categories
- Processor
- Memory
- Datastore
- Disk Volume
- Network Adapters
- Open Ports
- Hardware & Misc
- RAID Monitoring (Windows Servers Only)
- Windows Service (Windows) / Daemons (Mac & Linux)
- User Log
- Event Log (critical events)
- Antivirus
- Port Status
- Mobile devices
- Additional Resources
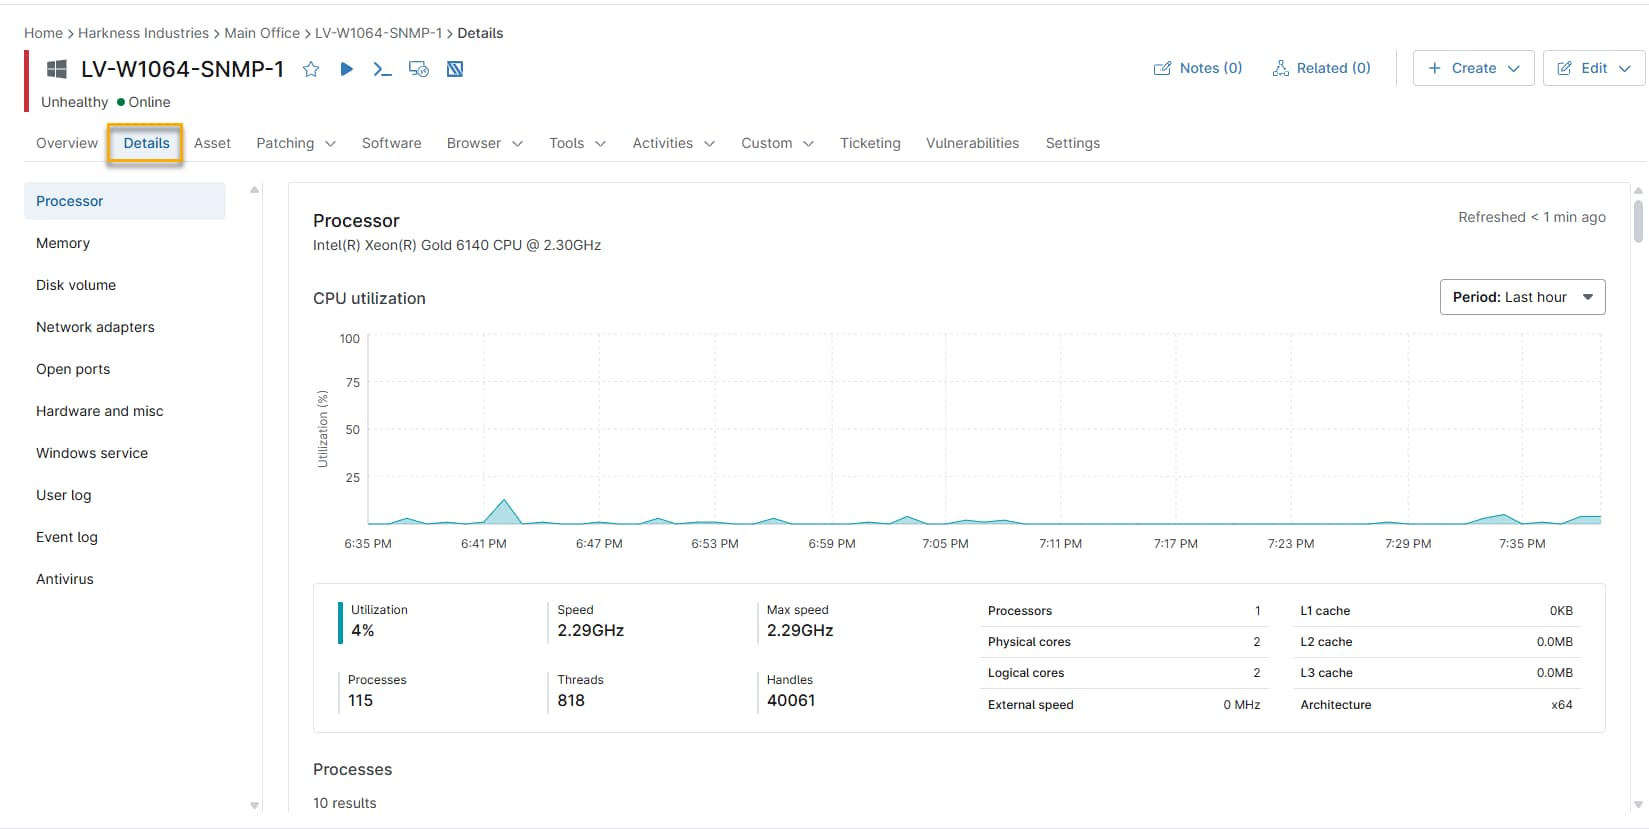
Processor
Available for: desktops, laptops, servers, Hyper-V hosts, and VMware.
This section provides a graph of CPU utilization and a table that includes the PID, process, threads, and CPU percentage for each process currently using the CPU on the device.
The details below the graph include the latest submission data. This data does not reflect the retention period of the graph.

Memory
Available for: desktops, laptops, servers, Hyper-V hosts, VMware, and mobile devices
This section provides a graph of memory usage over your specified time period and a table that includes the PID, process, commit, working set, shared, and memory for each process using memory on the device.
The details below the graph include the latest submission data. This data does not reflect the retention period of the graph.
- Apple mobile and MDM-enrolled macOS details will only include the amount of storage currently used, out of the total storage in GB.
- Android mobile details include RAM, internal storage, and external storage used, out of the total amount in GB.

Datastore
Available for: Hyper-V hosts
This section provides information about the device's virtual disk space and usage, read and write speed, available free space, and capacity.
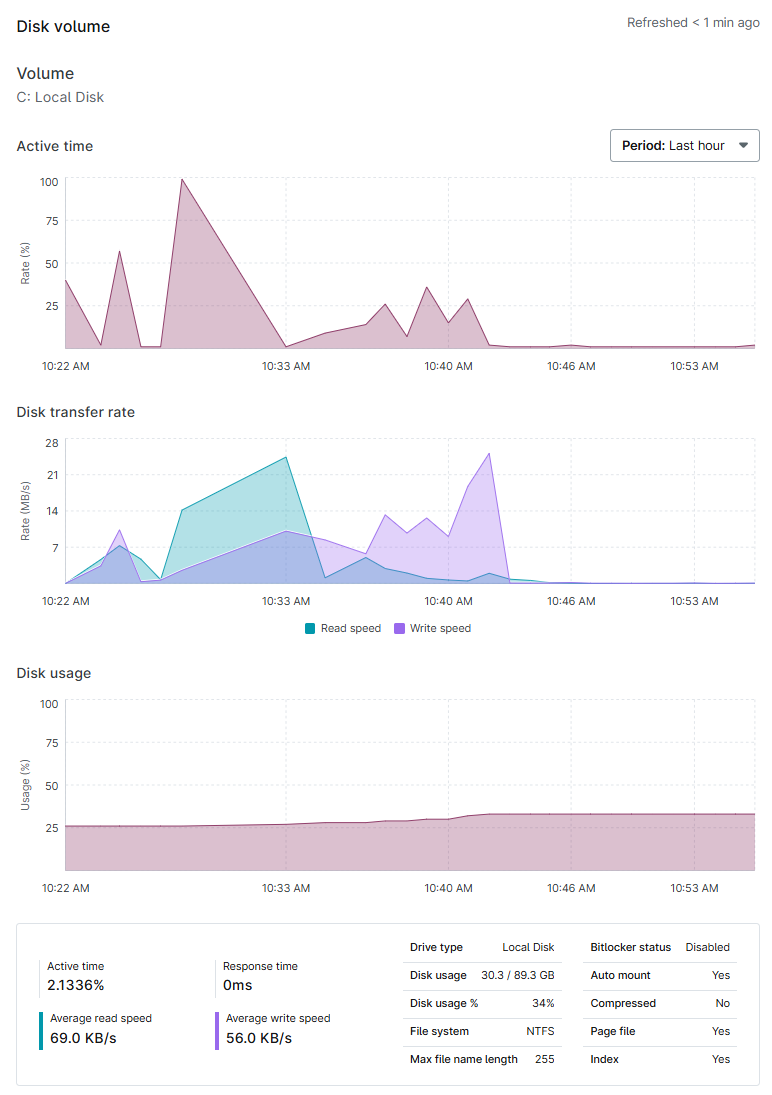
Disk Volume
Available for: desktops, laptops, and servers
This section provides graphs for each disk volume for the device, showing active time, disk transfer rate, and disk usage. You will also see the BitLocker status for each volume. For more information, refer to BitLocker and FileVault Encryption Key Management.
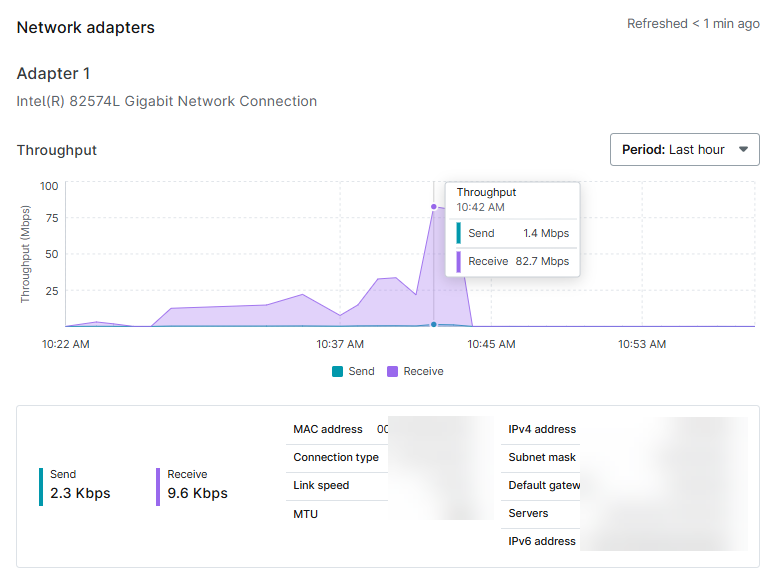
Network Adapters
Available for: Desktops, laptops, servers, and VMware
This section provides graphs that show the throughput for each network adapter on the device.
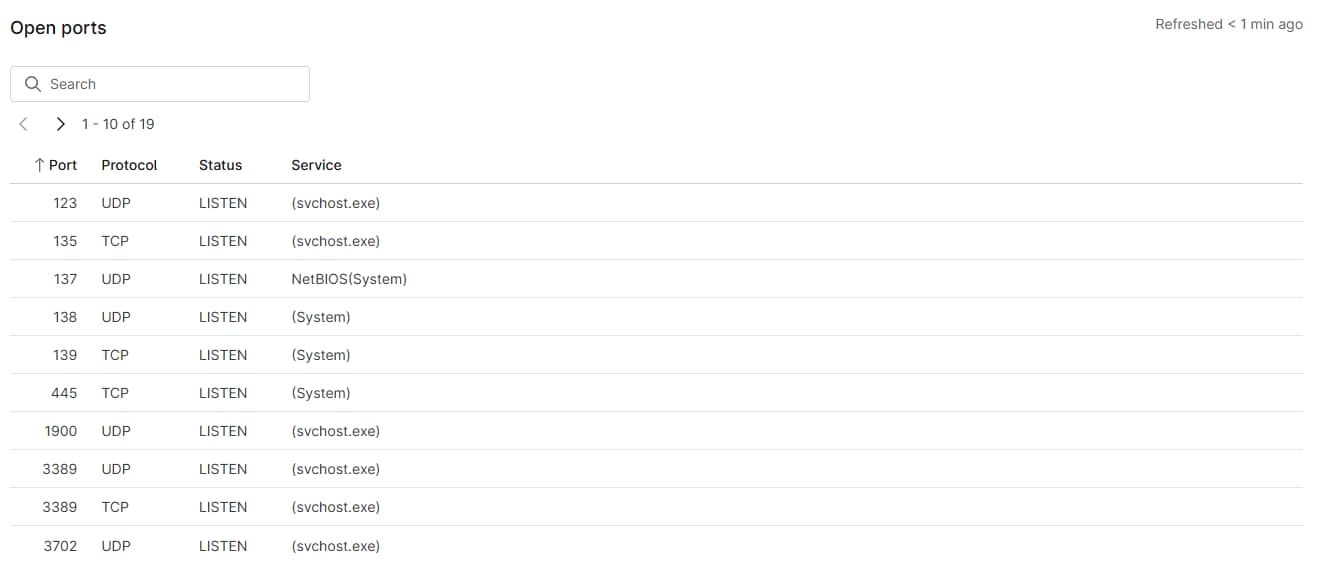
Open Ports
Available for: Desktops, laptops, servers, and servers
This section provides a table showing the port, protocol, status, and service.
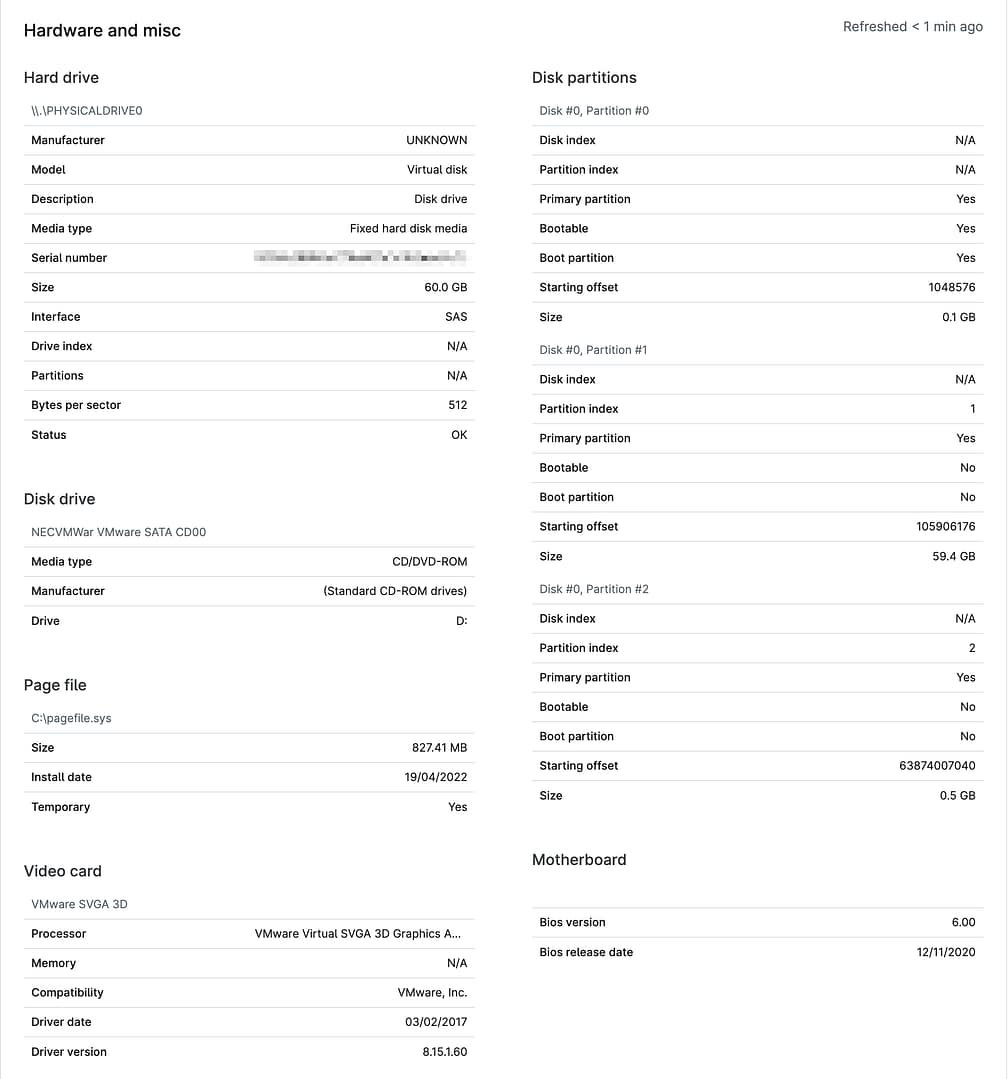
Hardware and miscellaneous
Available for: Desktops, laptops, and servers
This section lists information about the device's hard drive, disk partitions, sound card, video card, disk drive, page file, and motherboard.
RAID Monitoring (Windows servers only)
Available for: Windows Servers
NinjaOne can pull RAID monitoring data for Dell or HP RAID controllers.
This section includes:
- a table with controller details, a table listing virtual drives and their respective details/status.
- a table listing physical drives and their respective details/status.
For HP RAID controllers, the relevant HP utilities need to be installed on the machine for NinjaOne to monitor the controller's details.
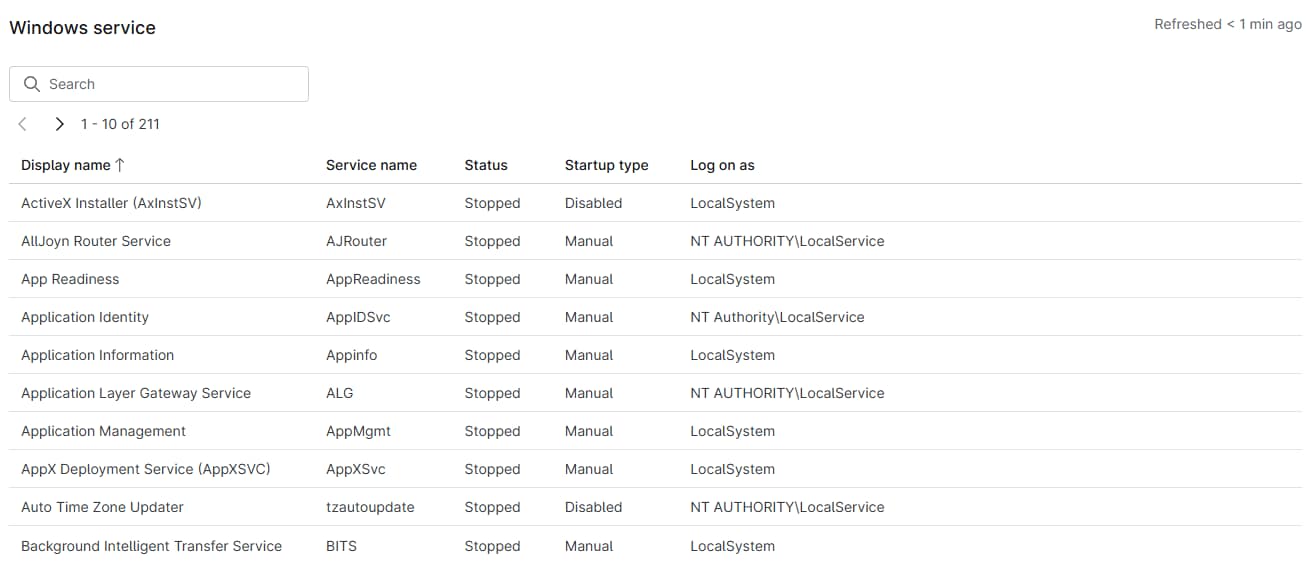
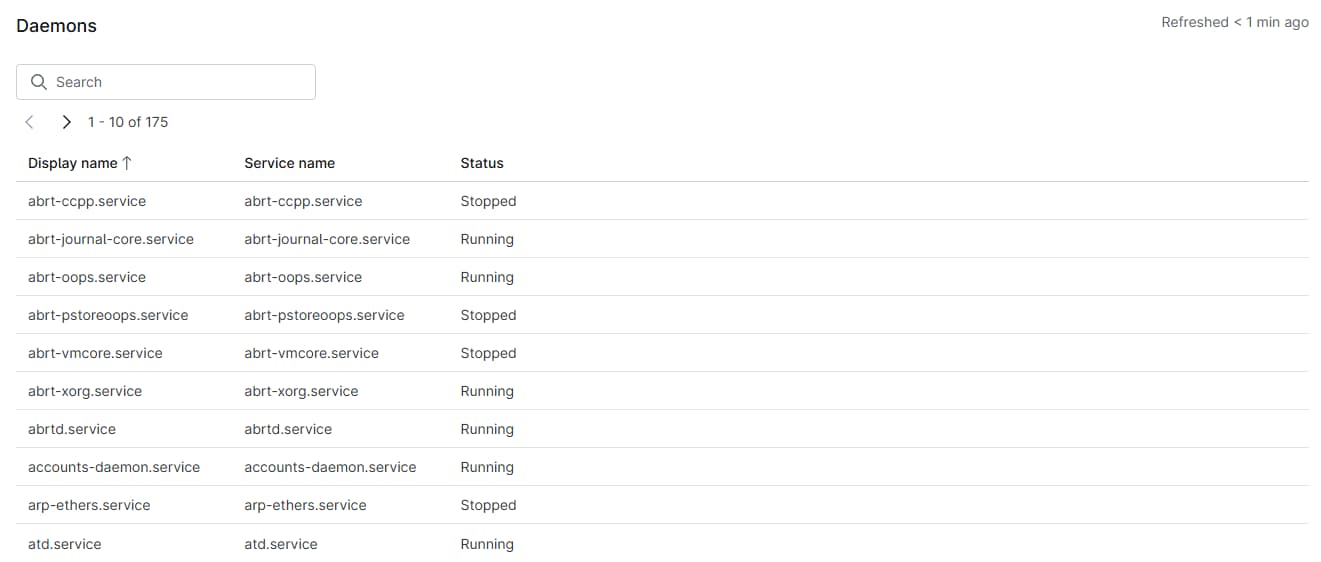
Windows Service (Windows) or Daemons (Mac & Linux)
Available for: Windows and Linux devices, respectively.
Windows devices: This section includes a table with the display name, service name, status, start type, and log-on-as information for each Windows service on the device.
Linux Daemons:
This section includes a table with the display name, daemon name, and status information for each background process on Mac and Linux devices.
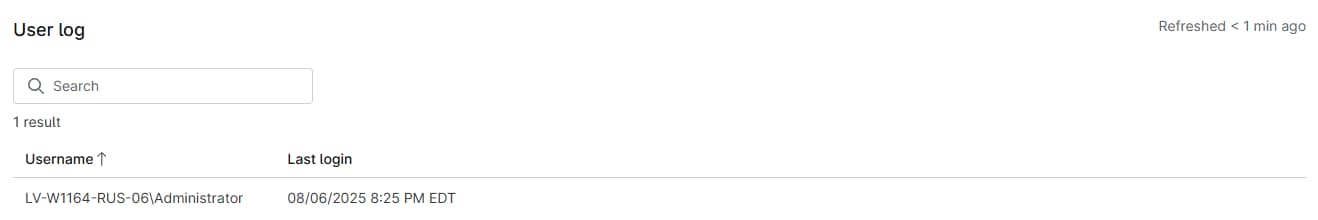
User Log
Available for: Desktops and laptops
This section includes the username and login date and time for the most recent incident of a user logging in to a device.
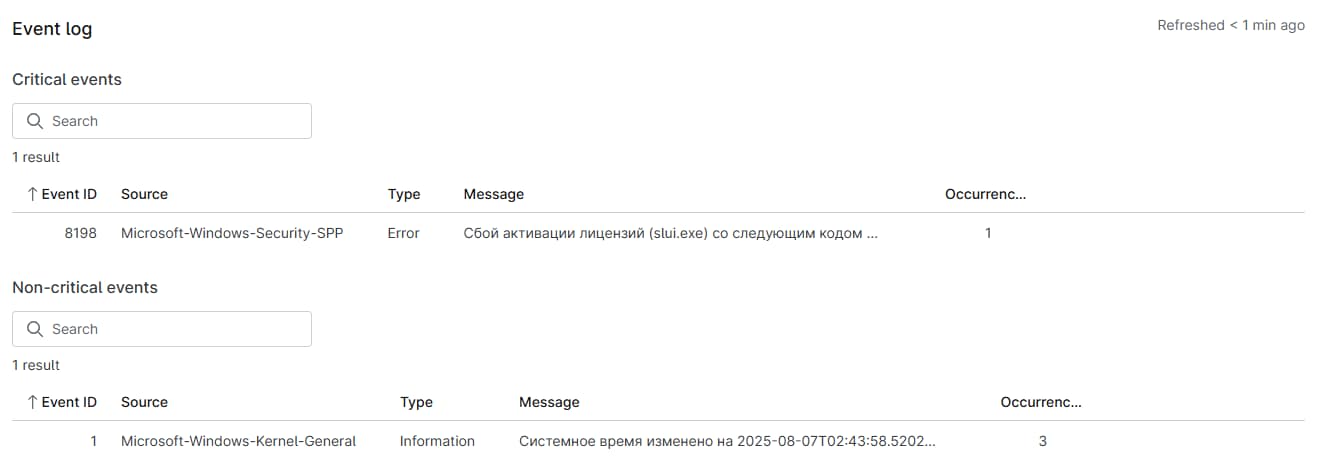
Event Log
Available for: Desktops and laptops
This section includes tables with Critical and Non-Critical events that have occurred on the device. This data gets purged every night at approximately 22:00 ET, and only events that have occurred within the last 3 hours will be kept. So, the log will always reflect events that have occurred on the device from approximately 19:00 ET onwards. The event ID, source, type, message, and occurrences are included in the tables.
The Critical section will list any event classified as Critical or Error. The Non-Critical section will list any event classified as anything but Critical or Error (which leaves the remaining event types: Information, Success Audit, Failure Audit, Warning, and Verbose).
All events classified as Critical, Error, Warning, or Failure Audit will be displayed automatically. Events classified with a type of Information, Success Audit, or Verbose will be displayed only if you have a condition set up to monitor for the occurrence of the specific Event ID. Refer to Policies: Windows Event Conditions for more information. set up to monitor for the occurrence of the specific Event ID in question.
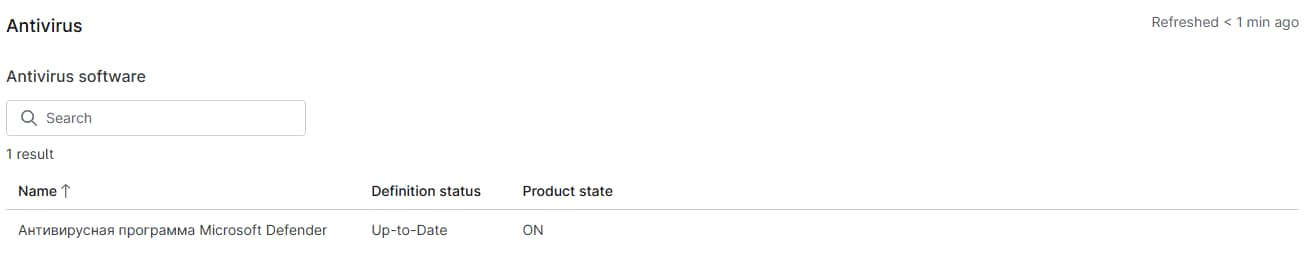
Antivirus
This section includes an antivirus (AV) overview, followed by a scan summary and details on the antivirus software installed. The antivirus summary includes a description, the number scanned, the number cleaned, and the scan duration. The last field includes a table with the name, definition status, and product state for AV software installed on the device.
NinjaOne aggregates antivirus data from Windows Security Center. For more information, refer to Reporting: Why does my Antivirus report show no information?
For information about how to feed antivirus information for servers into a custom file, refer to NinjaOne Agent Troubleshooting: Add an Override for Antivirus.
Port Status
Available for: Network monitoring agents
This section includes the port location for the device and its current state (connected, not responding, or other statuses).

Mobile devices
Compliance
This section is available for Android mobile devices and details the device's compliance state. If the device is not compliant, expand the section to see the reason for the violation.
Security
This section is available for Apple and Android mobile devices.
- Apple
- Encryption status (encrypted, not encrypted): This option includes block-level and file-level encryption.
- Is passcode compliant (yes, no): This information is pulled from the policy configuration page.
- Has passcode (yes, no): This information is pulled from the policy configuration page.
- Android
- Device posture (secure, not secure)
- Is PIN or password set (yes, no)
- Encryption status (encrypted, not encrypted): Both block-level and file-level encryption.
- Install apps from unknown sources enabled (yes, no)
- MacOS
- Encryption status (encrypted, not encrypted): Both block-level and file-level encryption.
Network
Apple mobile devices provide the International Mobile Equipment Identity (IMEI) number and Wi-Fi MAC address.
Cloud
- Backup enabled (yes, no)
- Last backup date
Additional Resources
Refer to the following resources to learn more about device management in NinjaOne: