Topic
This document covers the organization and device-level dashboards for NinjaOne Ticketing.
Environment
NinjaOne Ticketing
Description
- Organization Level Ticketing Dashboard
- Device Level Ticketing Dashboard
- System and Organization Level Ticketing Widget
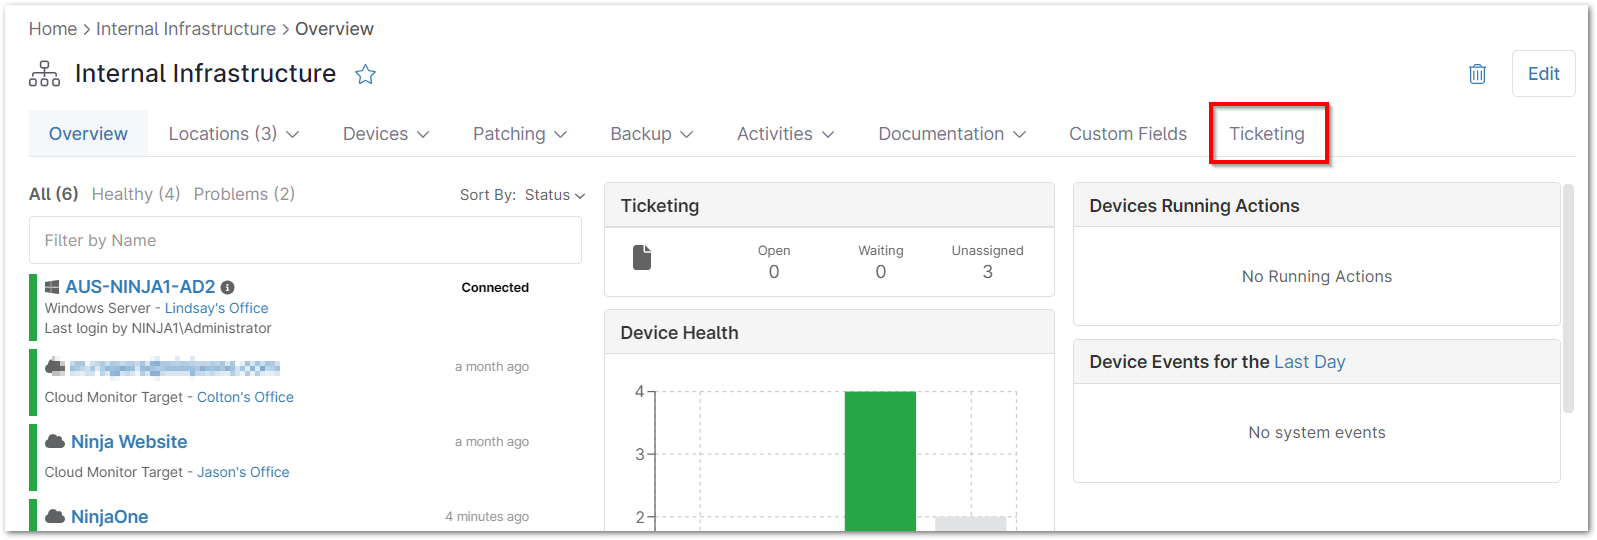
Organization Level Ticketing Dashboard:
To view the organization level ticketing dashboard, first navigate to one of your organizations and then select the Ticketing tab.
Below is an overview of the sections of the organization level ticketing dashboard, which include:
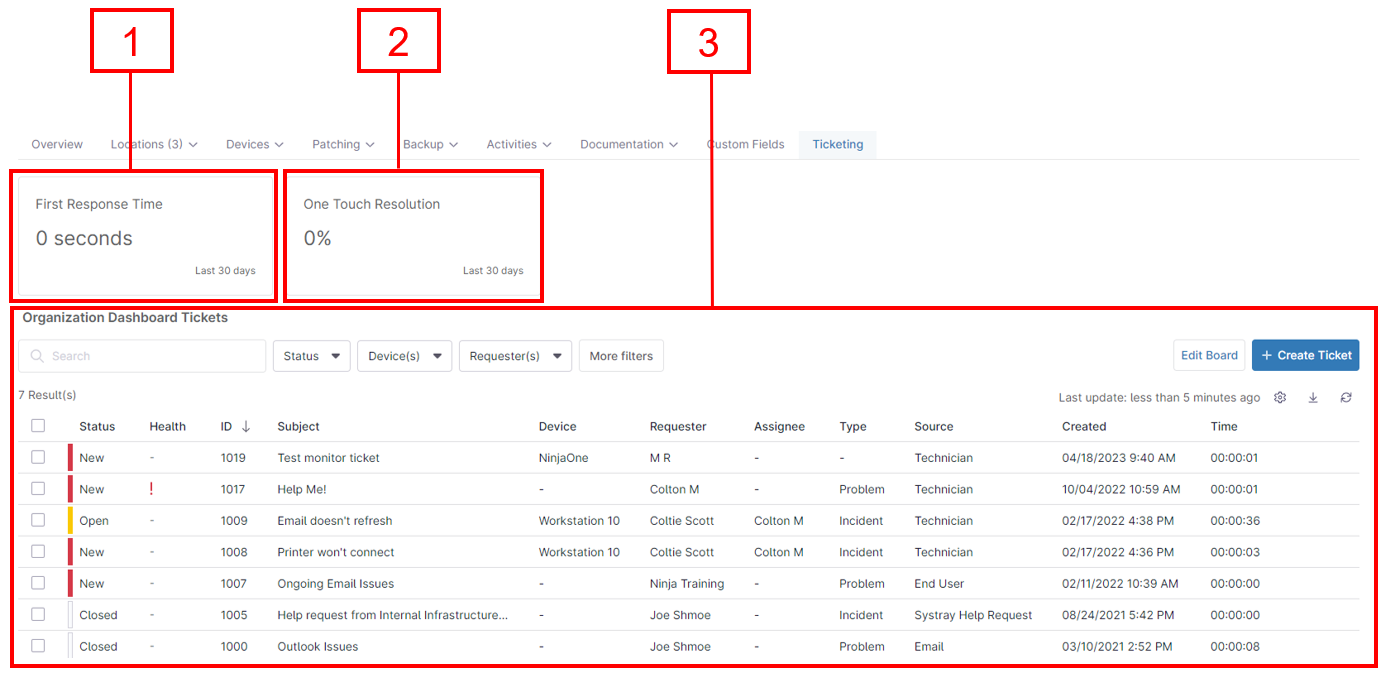
Average First Response Time
The first section in the organization level ticketing dashboard provides the average First Response Time for the last 30 days. The First Response is the first public comment added to a ticket after the ticket creation (to learn more about internal/public commenting on tickets, please see NinjaOne Ticketing: Ticket Handling). To calculate the First Response Time, the first public comment time is subtracted from the ticket creation time.
This field provides the average of all first response times for the matching tickets.
One Touch Resolution
This section in the organization level ticketing dashboard provides the average percentage of One Touch Resolutions for the last 30 days. A "Touch" refers to any public comment added by a technician. The metric used is the percentage of the number of matching tickets with 0 or 1 touches over the last 30 days.
Tickets should be in a status of Resolved or Closed but not Deleted.
Ticket Organization
The last section in the organization level ticketing dashboard displays all tickets related to the organization. These tickets can be filtered by Status, Device, Requester, Assignee, Tag, Created Date, Type and Ticket ID. 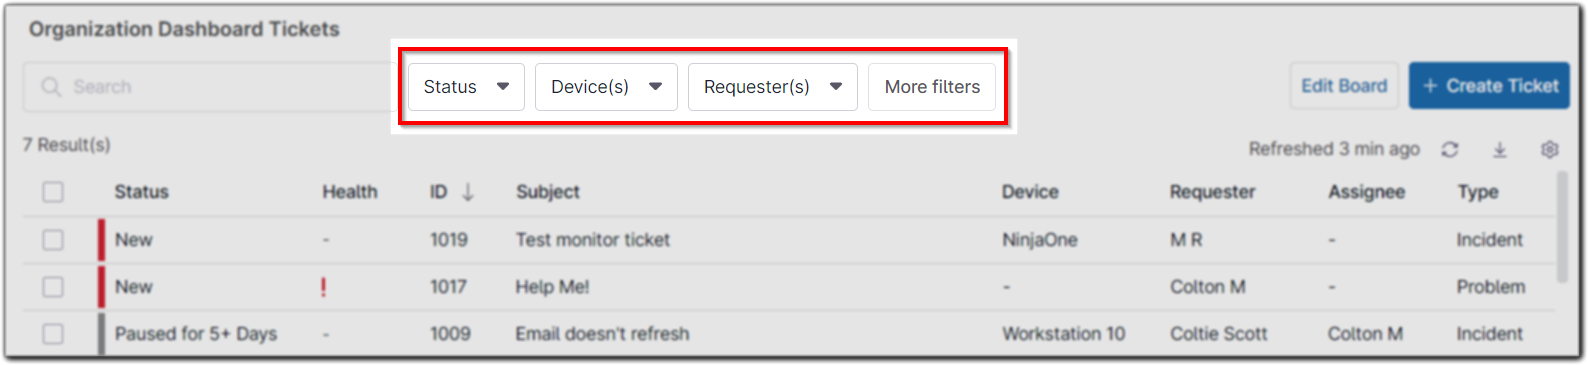
The information in this section of the dashboard can be exported. An export can include tickets only, tickets with public comments, or tickets with all comments (public and private). 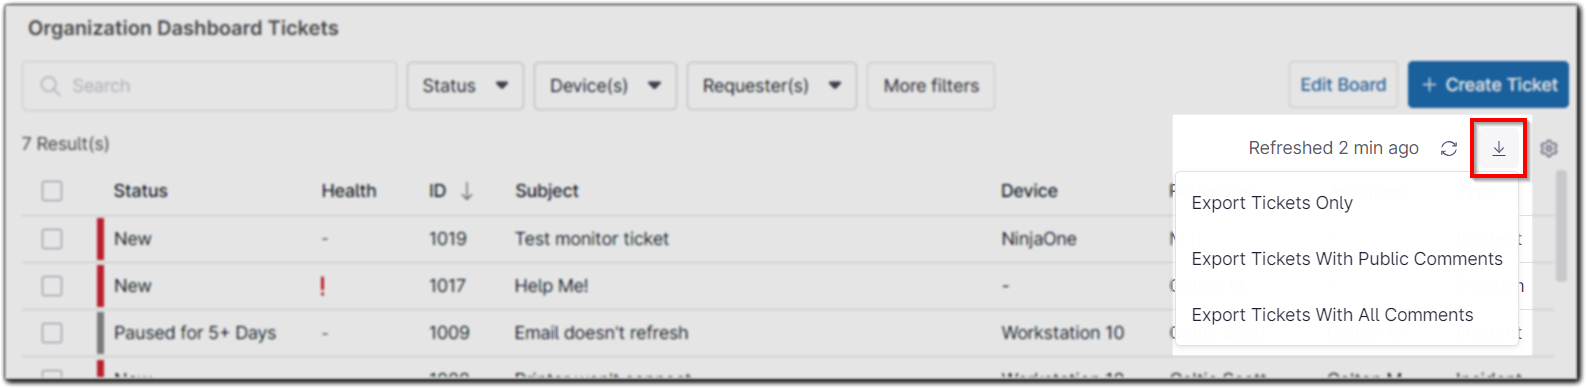
Clicking Edit Board allows you to configure how ticket information is displayed in this dashboard. This field can set how tickets are sorted, the direction of the sorting, and which columns are included. 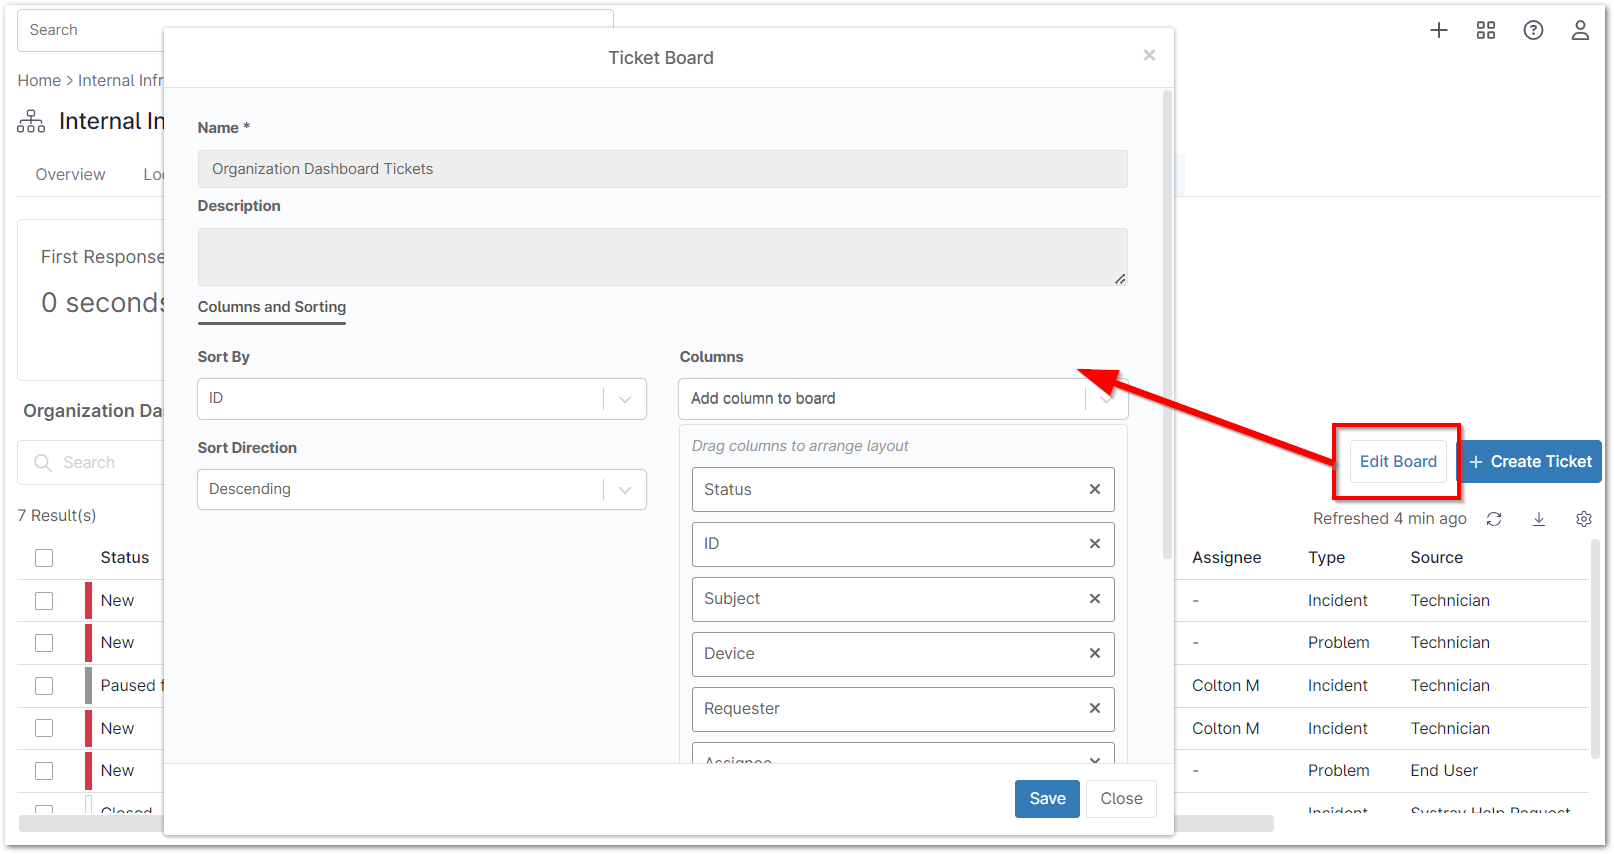
Move your mouse pointer over a ticket subject to view the associated tooltip.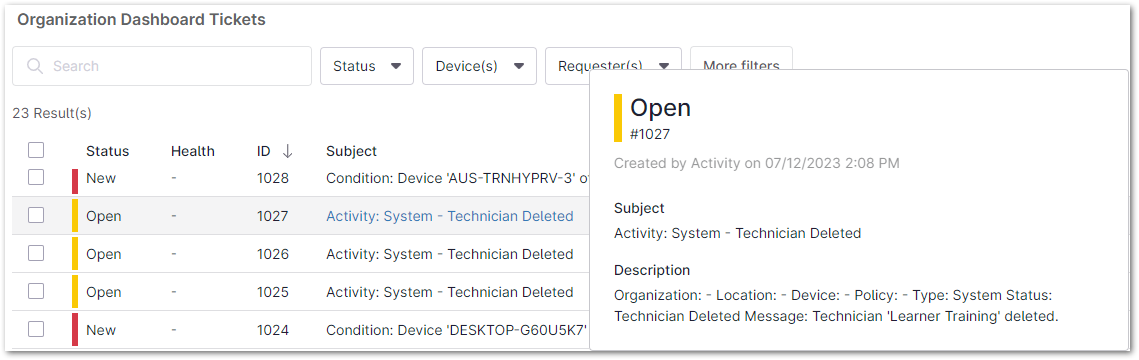
Device Level Ticketing Dashboard:
To view the organization level ticketing dashboard, first navigate to one of your organizations and then select the Ticketing tab. 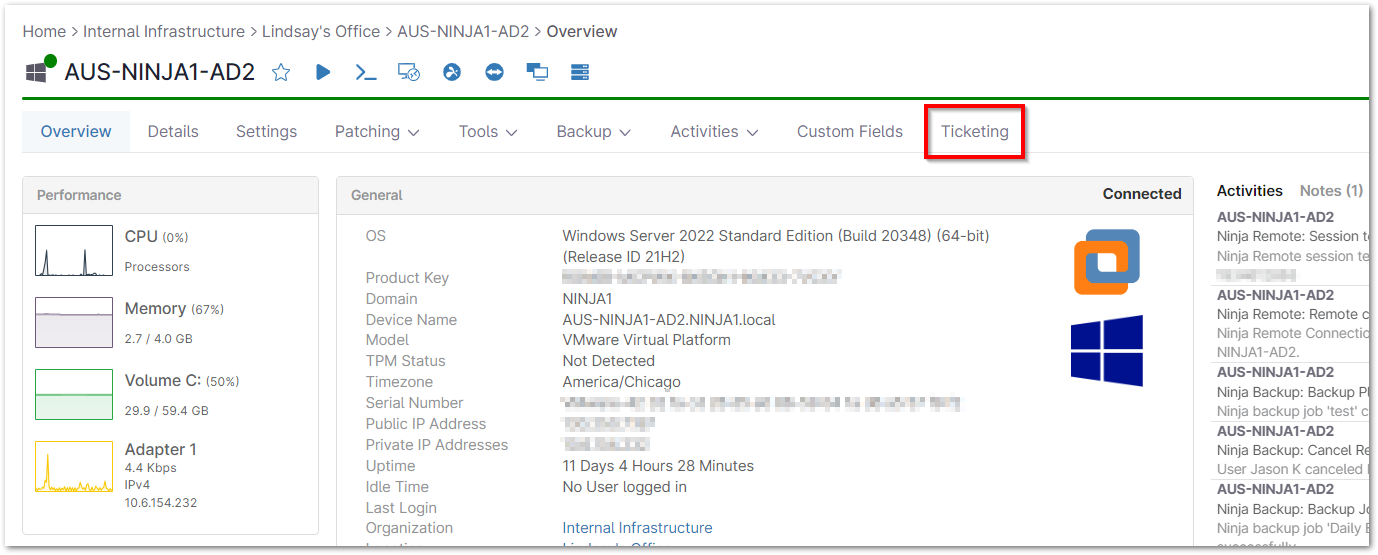
The information displayed is the same as that in the Organization-level dashboard, but specific to the tickets assigned to this particular device. To learn about the sections within the ticketing tab, select from the following options:
System and Organization Level Ticketing Widget:
An overview of ticketing is also available in the system and organization level overview dashboards. This information includes a count of all Open, Waiting, and Unassigned tickets. 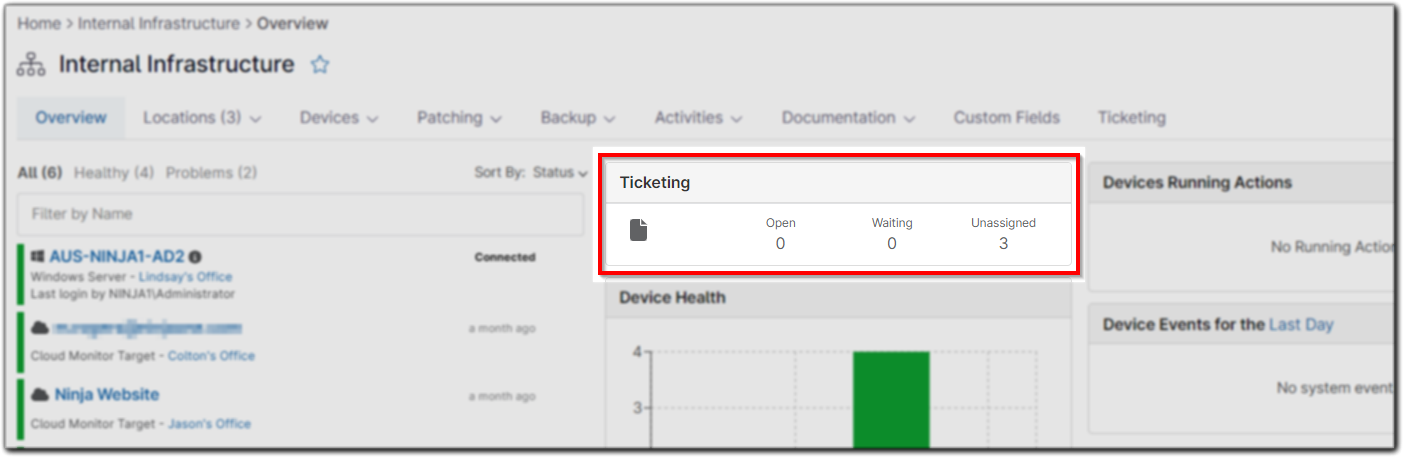
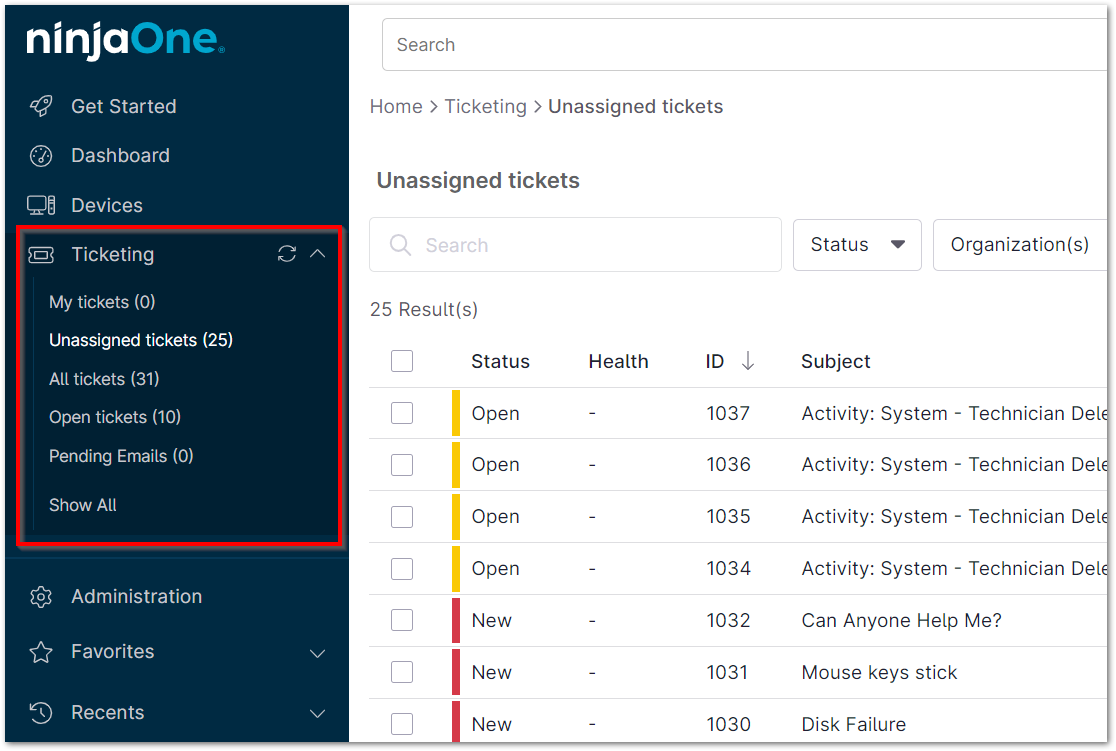
Lastly, ticket boards can be accessed via the left navigation pane below Devices.