Topic
This guide provides recommendations for building your endpoint monitoring and alerting strategy as well as step-by-step instructions for building 30+ custom endpoint monitoring conditions in NinjaOne.
Environment
NinjaOne platform
Index
- Introduction
- Device Health Monitoring
- Drive Monitoring
- Application Monitoring
- Network Monitoring
- Security Monitoring
- 4 Keys to Leveling-up Your Monitoring
- Ticketing & Alerting Best Practices
Device Alerts on the System Dashboard
Access the Alerts data on the system dashboard under the Devices tab.
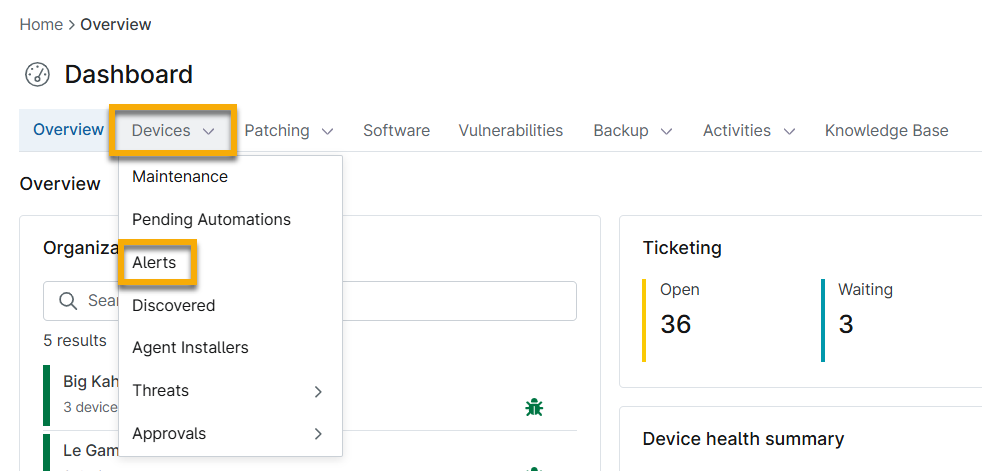
Figure 1: Access Alerts on the system dashboard
This dashboard also allows you to quickly filter these activities by the following options:
| Column | Properties |
| Date range | Choose a date range (last day, last week, last month, or last three months) for when the alert was initially triggered. |
| Device types | Choose a specific device type or types to filter the list by. |
| Conditions | Search for specific conditions that are currently triggered. |
| Organizations | Choose a specified organization or organizations to filter the list by. |
| Locations | Search for a specified location or locations to filter the list by (if you have any organization filters selected, the list of available locations will update to reflect only the locations under the specified organization(s)). |
| Devices | Filter the list by specified devices. |
- Each column can be sorted. By default, all available columns are displayed in the table; use the gear icon under the filter dropdowns to manage column visibility. You can refresh the alert list at any time by clicking Refresh at the top of the list.
- The names of the devices, organizations, and locations are hyperlinks that take you to the dashboards for those devices, organizations, or locations.
- Click the data in the Alert column to see the details in a pop-up window. The alert details also contain the device name and the date/time that the alert was created.
- Activate the checkbox for one or more alerts to see the reset option.
Introduction
What Does Good Monitoring Look Like?
Monitoring and alerting are central to the effective use of an RMM. Good monitoring practices enable you to proactively identify issues, resolve them faster, and be more effective. Better monitoring can also play a key role in generating additional revenue and keeping your clients more satisfied.
The challenge is knowing what to monitor for, what requires an alert, which issues can be automatically resolved, and which need a personal touch. That knowledge can take years to develop, and even then the best teams can still struggle with reducing alert fatigue and ticket noise across client devices.
To help those just getting started condense that ramp-up time and narrow their focus, we’ve put together this list of ideas for 25+ conditions to monitor. These recommendations are based on suggestions from our partners and from NinjaOne’s experience helping MSPs build effective, actionable monitoring.
For each condition we describe what is being monitored, how to set up the monitor in NinjaOne, and what actions should be taken if the condition is triggered. Some monitoring suggestions are concrete while others may require a small amount of customization to fit them to your use case.
These monitoring ideas are obviously not exhaustive, and may not apply to every situation or circumstance. Once you’ve gotten started building out your monitoring around these suggestions, you’ll need to develop a more customized and robust monitoring strategy specific to your clients and their needs. We end this guide with additional recommendations to help with that effort and make monitoring, alerting, and ticketing a competitive advantage for your MSP.
Device Health Monitoring
Monitor for continuous critical events |
|
Identify when a device is unintentionally rebooted |
|
Identify devices in need of a reboot |
|
Monitor for offline endpoints |
|
Monitor for hardware changes |
|
Monitor for prolonged high CPU usage |
|
Drive Monitoring
| Monitor for potential disk failure |
|
| Identify when disk space is approaching capacity |
|
| Monitor for potential RAID failures |
|
| Monitor for prolonged high disk usage |
|
| Monitor for high disk activity rate |
|
| Monitor for high memory usage |
|
Application Monitoring
| Identify if required applications exist on an endpoint |
|
| Monitor whether critical applications are running (particularly for servers) |
|
| Monitor resource usage for applications known to cause performance issues |
|
| Monitor for application crashes |
|
Network Monitoring
| Monitor for unexpected bandwidth usage |
|
| Ensure network devices are up |
|
| Monitor which ports are open |
|
| Monitor client website availability |
|
Security Monitoring
| Identify if Windows Firewall has been turned off |
|
| Identify if antivirus and security tools are installed and/or running on an endpoint |
|
| Monitor for unintegrated AV / EDR threats detected |
|
| Monitor for failed user logon attempts |
|
| Monitor for the creation, elevation, or removal of users on an endpoint |
|
| Identify if the drives on an endpoint are encrypted/unencrypted |
|
| Monitor backup failures (NinjaOne Backup) |
|
| Monitor backup failures (other backup vendors) |
|
4 Keys to Leveling-up Your Monitoring
- Create a baseline device health monitoring template.
- Talk to customers about their priorities.
- Which servers and workstations are important?
- What are their critical line of business or productivity
applications? - Where are their IT pain points?
- Monitor your PSA / ticketing system for recurring issues.
- Adjust alerting to avoid ticket noise.
- Monitor clients’ event logs for recurring issues.
Ticketing & Alerting Best Practices
- Only alert on actionable information - if you don't have a specific response associated with a monitor, don't monitor it.
- Categorize your alerts to go to different service boards in your PSA.
- Host regular alert housekeeping meetings to discuss.
- Which alerts are causing the most noise? Can they be removed or narrowed in scope?
- What is not being monitored or creating notifications that should be?
- Which common alerts can be automatically remediated?
- Are there any upcoming project that may generate alerts?
- Clean up your tickets and alerts when they are resolved.
- In NinjaOne, many conditions have a ‘Reset when no longer true’, or ‘Reset when not true for x period’ to help you resolve and cleanup notifications that may resolve themselves.