Already a NinjaOne customer? Log in to view more guides and the latest updates.

Dashboard Inventory Alerts

reviewed by Ian Crego

What is a Dashboard Inventory Alert?

One of NinjaOne’s most important features is its single-pane-of-glass view, which lets you see a broad set of information in one place and make quick decisions to keep your IT environment in optimal condition. The NinjaOne dashboards display ongoing inventory alerts as small colored icons that highlight issues requiring attention.

On the right side of each device or organization—depending on the dashboard you are viewing—you will see these colored icons if any alerts are present. These are the Dashboard Inventory Alerts.

The colors indicate the alert level: yellow signals that something needs attention, and red indicates an unhealthy or critical condition. The number near the icon indicates how many devices show this alert. Hover over each icon to view more details on the issue.

The screenshot below shows an example of the System Dashboard displaying these alerts for each organization.

Dashboard Inventory Alert

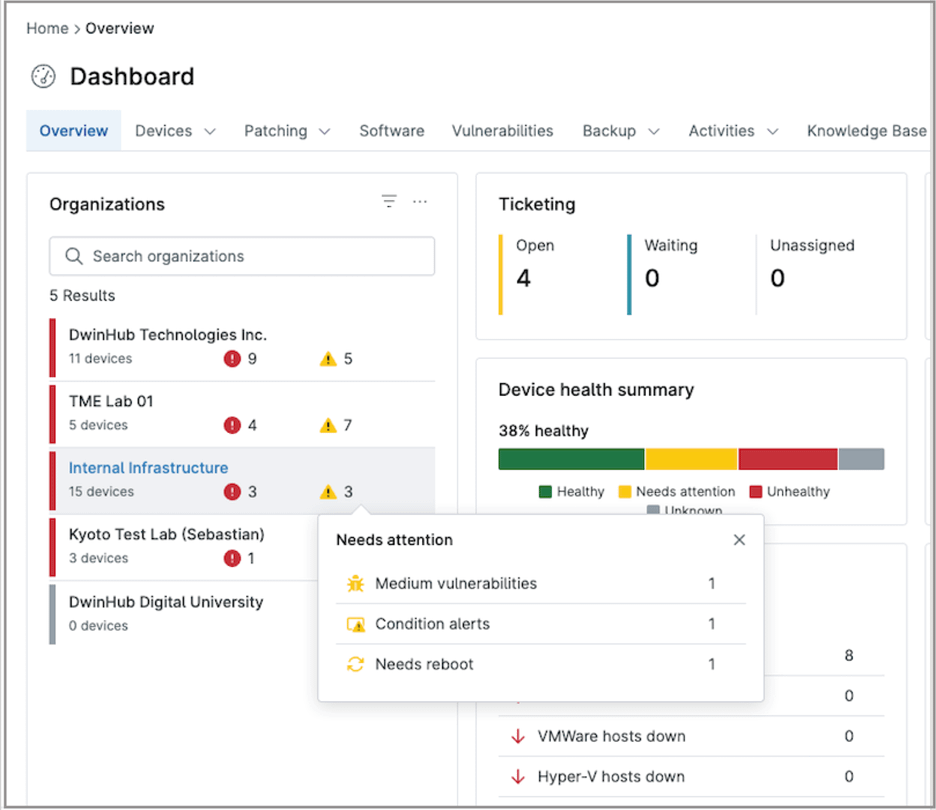
Each yellow or red icon represents an inventory alert. When you hover over an icon, you can see a summary of the issues—for example, one device with a medium-severity vulnerability, another with a condition alert, and one that requires a reboot. Clicking any of these icons opens additional details, such as which specific device or devices are affected.

Device health overview

The System Dashboard and the Organization Dashboard each provide a device health overview. This overview includes a bar graph showing the percentage of devices that are healthy, need attention, are unhealthy, or have an unknown status. A detailed breakdown by status is also displayed.

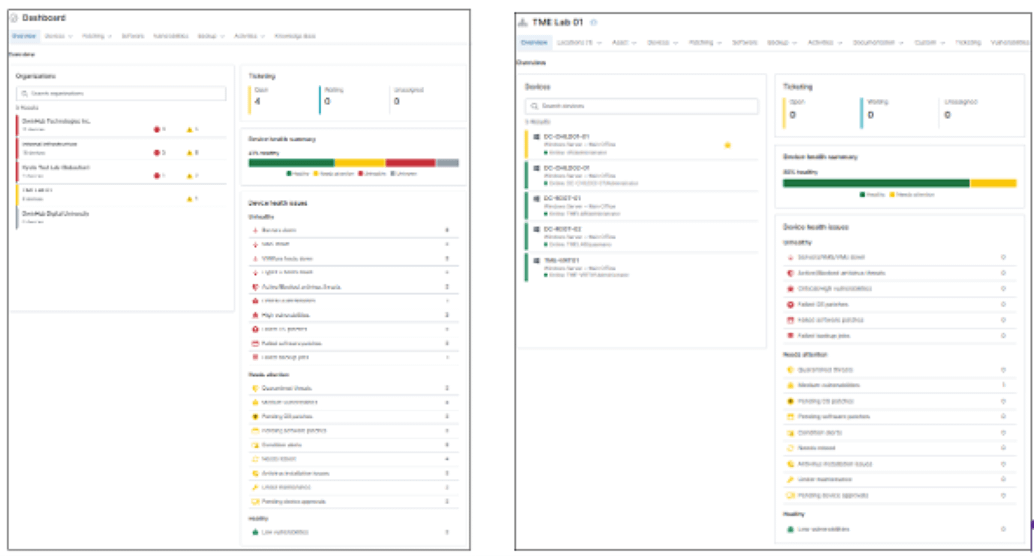
In the screenshots below, the image on the left shows the device health overview from the System Dashboard, while the image on the right shows the same section from the Organization Dashboard. Only one graph is visible in the UI at a time; both are shown here for comparison purposes.

The graph on the left shows the health overview across all organizations in the tenant, while the graph on the right shows the health overview for a single organization

Device health overview

Besides viewing the inventory alerts, what quick actions are available to solve alert related issues?

When you are in the Organization Dashboard, alerts are displayed next to each device. When you hover your mouse over a device name, a blue play icon appears. Hovering over this icon opens a window with a contextual menu of quick actions you can use to resolve the issues related to the alert. The available options vary depending on the specific problems detected. See the screenshot below for reference.

Organization Dashboard

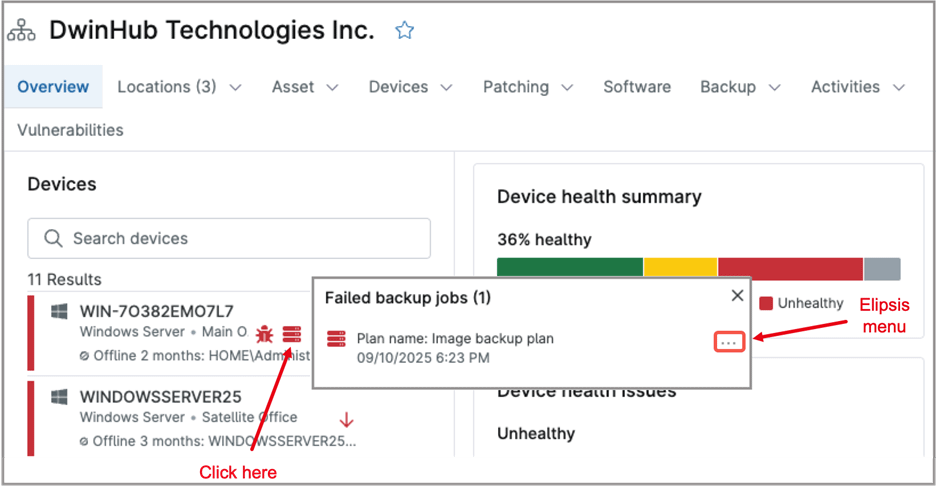
Some alerts include the option to view additional details—for example, backup-related alerts. Click the alert icon to display more information about the issue; a modal appears with additional details, along with an ellipsis menu for further actions. See the screenshot below for reference.

Modal with additional details

 When you click the ellipsis menu, a set of quick actions appears to help you address the issue.

Can I see an activity log for my devices?

Yes. NinjaOne includes an “Activities” window that displays all running actions and preserves them as historical records. In addition to storing past activity for reference, the window also shows actions executing in real time. For example, if you apply a corrective action such as a system reboot, the Activities window will display this event as it occurs.

To open the “Activities” window, go to the device panel and click the Toggle Activities button in the top-right corner. See the following screenshot for reference.

Toggle Activities
By default, the Activities window displays activity for all devices in the tenant. You can apply filters to limit the view, and once a filter is set, only the activities related to the selected devices will appear. You can also view the activity history for a single device by opening its device dashboard and selecting the Activities menu.

FAQ

Dashboard Inventory alerts are small icons displayed next to a device (or an organization, depending on the dashboard), indicating issues that need attention. The icons are color coded to give an idea of the severity of the problem.

There are two ways to see Inventory alerts:

  1. Click Devices from the NinjaOne main console. The Health Detail column displays any applicable inventory alerts for each device.
  2. From the NinjaOne main console, click Dashboard. If any issues are present, yellow or red icons with a number will appear next to each organization name. This number indicates how many devices in that organization require attention.