Key Points
Power BI visualizations enable MSPs to turn endpoint and patch data into client-ready reports that support clearer QBRs and more informed conversations.
- Collect inventory, patch history, and failure data through PowerShell to build the core dataset for visualization.
- Use registry tagging (manually or via GPO) to standardize device metadata, enabling richer segmentation in dashboards.
- Build structured Power BI reports by cleaning data, defining relationships, and creating visuals such as bar charts, tables, pies, and slicers.
- Enhance reporting by integrating NinjaOne exports or APIs to automate data collection and reduce manual processing.
Drive insightful client conversations by transforming key metrics into engaging graphs when working with Power BI to visualize data. With modern tools and streamlined methods, you can craft consistent QBRs while relying less on costly business intelligence features.
This article explains how to build data-driven Power BI reports, reduce manual reporting time, and answer frequently asked questions.
Get real-time and visualized patch compliance dashboards using NinjaOne.
Creating an endpoint security presentation, simplified
Follow these steps to craft stakeholder-friendly patch compliance reports. But before you do, ensure that these methods align with your goals, scope, and technical constraints.
📌 Prerequisites:
- Microsoft Power BI Desktop (free version)
- PowerShell 5.1+ (or PowerShell Core in Windows Terminal)
- Admin access to collect endpoint and patch data from devices or RMM
- CSV or JSON file format for ingesting local/regional data into Power BI
- Optional: NinjaOne for patch data exports or endpoint metadata collection
📌 Recommended deployment strategies:
| Click to Skip to a Step | 💻 Best for Individual Users | 💻💻💻 Best for Enterprises |
| Step 1: Data Collection via PowerShell | ✓ | ✓ |
| Step 2: Registry Tagging via PowerShell | ✓ | ✓ |
| Step 3: Registry Standardization via GPO | ✓ | |
| Step 4: Visualize data with Power BI | ✓ | ✓ |
| Step 5: Integrate NinjaOne Insights | ✓ |
Step 1: Collect endpoint inventory and patch status via PowerShell
📌 Use Cases: Produce a complete list of endpoints, track patch history, and more with advanced cmdlets.
- Press Win + R, type PowerShell, and press Ctrl + Shift + Enter.
- To generate patch history, run:
Get-HotFix | Select-Object Description, HotFixID, InstalledOn | Export-Csv "C:\Reports\PatchHistory.csv" -NoTypeInformation
- To query Windows Update failures, run:
Get-WinEvent -FilterHashtable @{LogName='System'; ID=20} |
Where-Object { $_.Message -like "*failed*" } |
Select-Object TimeCreated, Message | Export-Csv "C:\Reports\PatchFailures.csv" -NoTypeInformation
- To export basic device inventory, run:
Get-CimInstance Win32_ComputerSystem | Select-Object Manufacturer, Model, TotalPhysicalMemory |
Export-Csv "C:\Reports\EndpointInventory.csv" -NoTypeInformation
Step 2: Tag devices locally with registry keys for categorization
📌 Use Cases: Automate device tagging via PowerShell scripts.
- Press Win + R, type PowerShell, and press Ctrl + Shift + Enter.
- To create a registry path for device tags, run:
New-Item -Path "HKLM:\SOFTWARE\Org\ReportingTags" -Force
Set-ItemProperty -Path "HKLM:\SOFTWARE\Org\ReportingTags" -Name "PatchTier" -Value "<PriorityTier>"
Set-ItemProperty -Path "HKLM:\SOFTWARE\Org\ReportingTags" -Name "Department" -Value "<Department>"
Set-ItemProperty -Path "HKLM:\SOFTWARE\Org\ReportingTags" -Name "SLA" -Value "<Level>"
Replace:
- <PriorityTier> with that device’s risk tier (e.g., Critical, Standard, Low Priority).
- <Department> with the department name in your organization (e.g., Finance).
- <Level> with the expected degree of service (e.g., Critical, High, Moderate, Low).
- To export your tags as a .csv file, run:
Get-ItemProperty -Path "HKLM:\SOFTWARE\Org\ReportingTags" |
Export-Csv "C:\Reports\DeviceTags.csv" -NoTypeInformation
Step 3: Use GPO to standardize registry-based tags or log locations
Apply policies that simplify device tagging and control where logs are saved.
⚠️ Warning: Editing the registry can cause system issues. Create a backup before proceeding.
📌 Use Cases: Enterprise-wide registry tag configuration
📌 Prerequisites: Windows 11 Pro, Enterprise, or Education, Administrator privileges
- Press Win + R, type gpmc.msc, and press Ctrl + Shift + Enter.
- Right-click on your target Organizational Unit (OU) and select Create a GPO.
- If your GPO already exists, instead choose Edit an existing one.
- Navigate to: Computer Configuration > Preferences > Windows Settings > Registry
- Add new registry items for Patch Tier, Region, and Device Owners.
- Right-click Registry and select New > Registry Item.
- Set the following:
- Action: Create
- Hive: HKEY_LOCAL_MACHINE
- Key Path: SOFTWARE\Org\ReportingTags
- Value Name: e.g., PatchTier, Region, DeviceOwner
- Value Type: REG_SZ
- Value Data: e.g., Critical, APAC, Finance
- Standardize your log path with the following GPO settings:
- Registry key: HKLM\SOFTWARE\Org\ReportingConfig
- Value name: LogPath
- Value data: <LogFileDirectory>
Replace <LogFileDirectory> with your desired file path (e.g., C:\LogReport).
- Right-click on your target OU and choose Link an Existing GPO.
- Run gpupdate /force to manually refresh an endpoint’s group policy.
Step 4: Build a Power BI report using local data sources
This method creates a dashboard out of your .csv files. When working with Power BI to visualize data, consider integrating endpoint managers that already offer mapped metrics.
📌 Use Cases: Enhanced data insights for QBRs
- Open Power BI Desktop.
- Navigate to: Home > Get Data > Text/CSV
- Load the following:
- PatchHistory.csv
- PatchFailures.csv
- EndpointInventory.csv
- DeviceTags.csv
- Clean and transform your data with Power Query Editor.
- Configure relationships using the Model view.
- Craft visuals that reflect patch data.
- Bar chart: Show patch failures over time.
- Table: Organize devices by risk tier and their current health status.
- Pie chart: Compare the number of endpoints by department.
- Slicers: Create filters for different SLAs, regions, and clients.
- Save your presentation as a .pbix file for local use, or publish it on the Power BI Service for client use.
Step 5: Enhance with NinjaOne data export or API
Leverage NinjaOne’s versatile dashboard to export patch compliance for QBRs or Power BI.
📌 Use Cases: Automate data collection, visualize installed/uninstalled patches, and capture pre-built visuals for QBR presentations.
📌 Prerequisites: NinjaOne RMM access with reporting permissions.
- Log in to the NinjaOne Admin Console.
- Navigate to Reporting and locate a specific Patch report, or pull up a Device’s patch history details.
- Export relevant device data like:
- Installed patches
- Missing updates
- Patch compliance (per device)
- Create custom fields in NinjaOne that mirror variables such as PatchTier, Department, and Region for better data segmentation.
- Save your exported file as a CSV for Power BI or other centralized visualization tools.
- Create an automation policy (optional) to:
- Synchronize registry values with NinjaOne tags
- Schedule patch data exports
- Trigger alerts on high-priority patch failures.
⚠️ Things to look out for
| Risks | Potential Consequences | Reversals |
| WMIC command misuse | Broken or incomplete inventory data | Use PowerShell cmdlets like Get-CimInstance instead. |
| CSV mismatch during merge | Relationship errors in Power BI | Use Power Query to clean and transform raw data before using the Model view. |
| PowerShell script error | Invalid export data and script crashes | Test script on a test machine first and review error logs/console messages. |
Important considerations when working with Power BI to visualize data
Here are the key points you should keep in mind while building your report:
Data freshness
Schedule regular endpoint data exports to catch security gaps and monitor device health across your organization. While important, this process can be repetitive, highlighting the need for export automation features that are often included in modern endpoint solutions.
Sensitive fields
Data screenshots can include sensitive information such as admin credentials, IP addresses, passwords, and other confidential details. Before exporting, make sure these are redacted from your patch data presentations.
Client custom views
Stakeholders may have questions about SLAs, departmental metrics, or more. To address any concerns, prepare customized slicers and dashboards tailored to client-specific needs.
NinjaOne achieves this and more with automated endpoint reports and patch summaries, providing an all-in-one solution— without the need to import data into analytics platforms like Power BI.
Non-Windows devices
Endpoint metrics rarely share nomenclature in mixed environments. Utilize RMM tools to standardize patch data across Windows, macOS, and Linux, thereby facilitating data collection.
Quick-Start Guide
NinjaOne offers robust patch management and visualization capabilities:
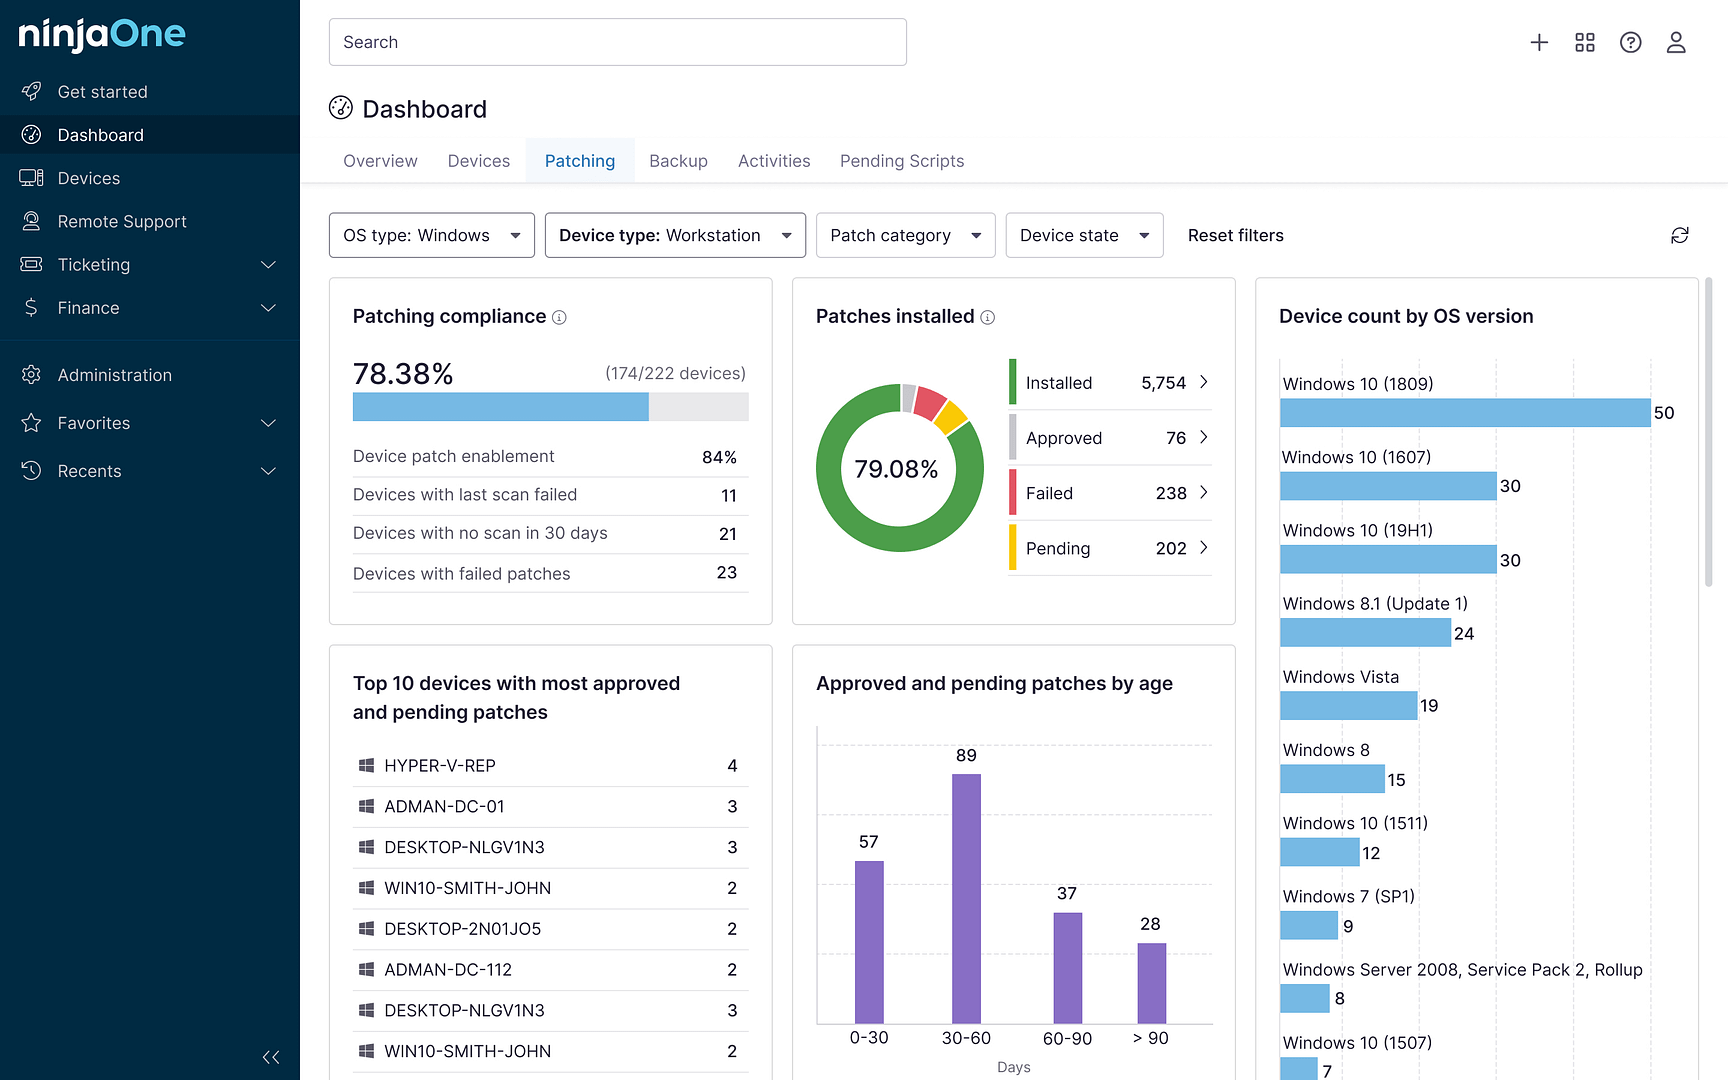
1. Patch Management Dashboard Features:
- Comprehensive view of software and OS patches across managed endpoints
- Filterable dashboards for OS and software patches
- Ability to export patch data to CSV for further analysis in Power BI
2. Key Visualization Options:
- Patch compliance percentage
- Devices by OS version
- Patch status breakdowns (approved, pending, failed, installed)
- Patch categories (critical updates, security updates, etc.)
- Top devices with most approved/pending/failed patches
3. Additional Insights:
- KB Analysis column with AI-powered patch sentiment
- CVE and CVSS score information
- Ability to filter by OS type, device type, and patch category
Troubleshooting Power BI report generation issues
Here’s how to fix common Power BI report-related roadblocks.
Power BI load errors
CSV files may fail to load or refresh properly. When this happens, ensure your file is closed before importing it into Power BI, as it may reject files due to structural issues and inconsistent formatting (e.g., column gaps, missing headers).
Incorrect date formats
If dates appear inconsistently across your data report, go to Power Query or Report view to set a column’s data type to “Date”. While manual setup is often required in BI tools, some platforms handle this automatically in the background.
Missing registry tags
Disappearing registry tags could be due to an incorrect path or an absent registry key. To fix this, confirm your script targets the correct file directory and that the registry tags exist.
CMD output issues
If your Command Prompt inventory doesn’t import cleanly, either export the file as .csv or parse through the .txt using PowerShell. Note that Power BI treats unstructured text as a single column if it’s not transformed.
Upgrade client presentations with NinjaOne
NinjaOne facilitates your endpoint security presentation by:
- Automating patch detection, deployment, and completion for quarterly reviews
- Monitoring compliance with real-time dashboards
- Providing customizable reports on system audits and SLAs
- Letting sysadmins define patching rules by group, department, or region
- Supporting remote workforce patching without relying on expensive VPNs
Utilize NinjaOne and immediately turn patch data into actionable insights.
Centralize control when working with Power BI to visualize data
Fast-track clear and effective patch compliance reports when you leverage scalable data collection services while building Power BI visuals. Built-in apps are used to collect work device metrics for later visualization, but doing so manually is often time-consuming and prone to error.
Eliminate IT headaches with unified dashboards that give MSPs and IT teams centralized control over your environment, simplified device tagging, and uncomplicated data collection.
Related topics:


