

Key Points
- Power BI Overview: Power BI is Microsoft’s all-in-one business intelligence platform for transforming raw data into interactive dashboards, visual analytics, and real-time business insights across Power BI Desktop, Service, for Microsoft Fabric, and Mobile.
- Getting Started & Installation: Learn how to install Power BI Desktop, meet system requirements, and navigate its interface, including the Ribbon, Data, Model, and Report views—the foundation for building impactful data visualizations.
- Data Import & Report Creation: Step-by-step guide to import data from files, databases, or cloud services, transform it using Power Query, and design reports with visualizations, filters, DAX measures, and relationships.
- Publishing & Collaboration: Discover how to publish Power BI reports to the cloud-based Power BI Service, share dashboards securely, export insights to Excel or PowerPoint, and collaborate through Microsoft Fabric integration.
- Advanced Features & Learning Resources: Explore analytics tools (forecasting, clustering, trendlines), custom themes, and community resources like Power BI documentation, forums, and blogs to master data-driven decision-making and business intelligence.
Microsoft Power BI (Business Intelligence) is an interactive business analytics tool that enables users to visualize data into easy-to-understand charts, graphs, and reports. Instead of having stakeholders look at raw numbers, the software presents trends and patterns visually through a suite of services.
If you’re looking for ways to integrate this tool into your workflow, this guide will explain how to use Power BI for creating reports and interactive dashboards.
For a quick visual overview, watch our video guide on How to Use Power BI: A Step-by-Step Tutorial
Getting started with Power BI
Types of Power BI
Power BI has four main platforms in its suite: Power BI Desktop, Power BI Service (Cloud-Based), Power BI in Microsoft Fabric, and Power BI Mobile Apps. Understanding the role of each can help you and your organization maximize the use of each service.
Power BI Desktop
Power BI Desktop is the primary application for consolidating reports and data sets. The software can be downloaded for free and installed on Windows-based systems.
Business analysts, data scientists, and developers tend to use Power BI the most. The workflow starts with Power BI Desktop, which processes data and builds compelling visual insights and reports.
Users can also customize it by integrating various smart and productivity apps, including AI Insights and other Microsoft applications.
Power BI Service (Cloud-Based)
Power BI Service is a cloud-based platform that facilitates collaboration between stakeholders. It enables users to publish, share, and collaborate on reports and dashboards created in Power BI Desktop.
This software can be integrated with SharePoint and other Microsoft apps to manage workspace and user access. Unlike Power BI Desktop, Power BI Service requires licenses and subscriptions.
In 2023, Microsoft made the Power BI Service a core component of the new Microsoft Fabric. You can continue to use Power BI by itself or leverage the new capabilities of Fabric with Power BI to do even more with your data.
Power BI in Microsoft Fabric
Since 2024, Power BI has been integrated into Microsoft Fabric, allowing users to access files through a unified data storage and use AI to automatically generate reports. Integrated tools that users can utilize here include Data Factory, Synapse, Data Activator, and Copilot AI.
Power BI Mobile Apps
Power BI Mobile Apps can be downloaded on smartphones and tablets for ease of access. Simply put, the app provides on-the-go access to crucial business metrics. However, it has limited input capabilities and is mostly optimized for viewing data.
Installing Power BI Desktop
Following that overview, here’s how you can install Power BI Desktop.
- Get the latest version of the Power BI Desktop installer for free. Click the link here.
- Click Download now or tap Advanced download options to select your preferred language.
- Run the installer and follow the prompts.
If you have a license, you can also download Power BI Desktop from the Power BI service dashboard. Navigate to Download in the top menu bar, and then select Power BI Desktop.
Power BI Desktop System Requirements
Microsoft provides the following minimum requirements to run Power BI Desktop:
- Windows 11 or Windows Server 2019+ recommended
- NET 4.8 or later; WebView2 mandatory
- Microsoft Edge browser (Internet Explorer is no longer supported)
- Memory (RAM): At least 2 GB available, 4 GB or more recommended.
- Display: At least 1440×900 or 1600×900 (16:9) required.
- CPU: A 1 gigahertz (GHz) 64-bit (x64) processor or better is recommended.
- WebView2: If WebView2 wasn’t automatically installed with Power BI Desktop or if it was uninstalled, download and run the installer for WebView2.
ℹ️ Note: Lower resolutions, such as 1024×768 or 1280×800, are unable to fully display UI controls. In addition, Windows display settings with the size of text, apps, and other items set to more than 100% may not properly display some dialogs that you must interact with to continue using Power BI Desktop.
You can check your display settings in Windows by going to Settings → System → Display. Then, use the slider to adjust the display settings back to 100%.
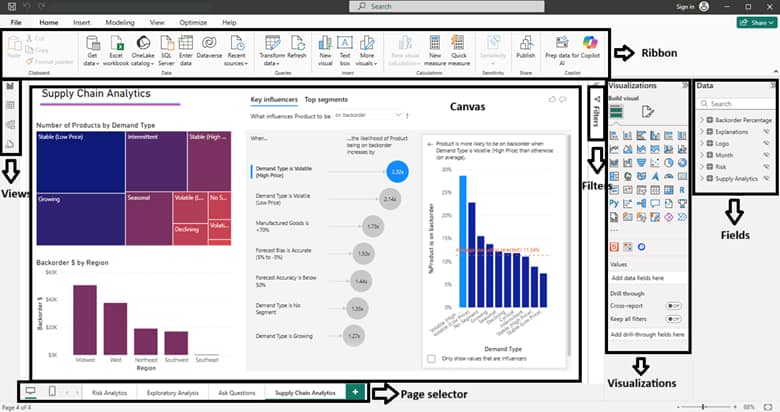
Navigating the Power BI Desktop interface
Upon launch, Power BI will start with a blank report. Here’s an overview of the general interface.
- Ribbon (top) – Primary controls and Home settings for creating a report.
- Views (left sidebar) – Choose from Report view, Data view, and Model view.
- Canvas (center) – The design area where visualizations and other elements are added.
- Page selector (bottom) – A navigation tool for going through the reports.
- Filters – Can be added here to filter and sort the data.
- Visualizations – A list of available visualizations, like charts, maps, cards, and more.
- Fields – Contains a selection of tables and fields that are available in the data model.
With that said, UI updates may have features reorganized or deprecated. Refer to the Power BI Desktop change log for recent updates.
🥷 Tip: You can move your cursor over any section or icon to see a label and short description. You can also collapse the Filters and Visualizations pane to customize your workspace.
Adding data and creating a Power BI report
Before you start designing reports, here’s how to import data:
Importing data into Power BI Desktop
- Click Get Data from the Home ribbon (top left) or File → Get Data.
- Connect data from a file, database, or connected cloud-based services.
- On the next pane, select whether to load the data directly or choose the Transform Data option to go straight to the Power Query Editor.
- Use the editor to filter, merge, and manage data types. Then, click Close & Apply.
Once transformations are complete, the cleaned and reshaped data is loaded into Power BI’s data model, ready for visualization and analysis.
ℹ️ Note: Changes in Power Query are not automatically synchronized. These updates will only apply to the model after confirming Close & Apply.
How to create a report in Power BI Desktop
Now that you have some data to process or have connected a data source, it’s time to build your report. Here are some actions that you can take to customize your data.
- To organize tables, click the Model icon (located on the left side) to open the Model view.
- (Optional) Under Home, tap Manage Relationships to create data relationships.
- Create Measures by using DAX (Data Analysis Expressions).
- Choose visualization types from the Visualizations pane (bar/line chart, table, etc.).
By default, Power BI Desktop will attempt to create relationships between columns to help prepare your report. To change this behavior, go to File → Options and settings → Options, and then select Data Load in the left pane to show additional options.
Publishing report to Power BI Service
If you have an active trial or Pro License, you can log in to the Power BI Service and publish the report in your Workspace.
- In the Home tab, press Publish.
- A prompt will ask you to select the Workspace where the report will be published.
- Click or copy the link that will be generated once the upload is complete.
The data associated with the report will also be published, which you can view separately in your Workspace. This dataset can be used to create additional reports or shared with other team members.
Reports published this way can be exported by stakeholders as Excel, PowerPoint, or PDF files for analysis or presentation. Users can also subscribe to the report to receive notifications when the data is updated.
You can pin entire reports or individual visuals to the dashboard for quick access. The dashboard is an excellent tool for tracking important metrics and activities. Lastly, users can view dashboards on the go using the Power BI mobile apps.
Additional tips on using Power BI Desktop and Power BI Service
Here are a few additional actions you can take to customize your reports and data presentation.
Adding visualizations, charts, and tables
Visualizations are a great way to organize and highlight specific data points, as well as provide an overview of the report. Here’s how you can add them:
- Look to the right side of the canvas to see the Visualizations pane.
- Click or select the visualization type.
- Assign fields to the visualization’s values, axis, and legend.
You can customize individual visualizations by adding colors, labels, and tooltips using the Format pane.
Customizing report layouts and formatting
- In the View tab, select Themes to apply predefined styles or create custom themes.
- Click a visual to select it, and use the Format pane on the right to customize colors, fonts, and other visual elements.
In addition, you can customize the report background and add borders to the presentation.
Incorporating Power BI analytics features
Power BI includes a number of advanced features that can be used to enhance your reports, including:
- Advanced analytics: In the Visualizations pane, click the Analytics icon 🔍 to enable features such as trendlines, reference lines, and clustering.
- Forecasting: In the Analytics pane, activate Forecasting to predict future trends.
- Statistical measures: Use DAX to create measures like median, variance, or percentiles and add them to visualizations.
- Insights: Use the Explain the Increase or Find where this distribution differs features for deeper insights.
Power BI documentation and resources
Power BI offers extensive documentation and learning resources. The official Power BI documentation provides in-depth information on various features and functionalities. Some of our favorites include:
- Microsoft Power BI forum: The official community forum hosted by Microsoft for Power BI users. It includes various categories such as Desktop, Service, Mobile, and more. Users can ask questions, share ideas, and collaborate with other Power BI enthusiasts. Microsoft experts and MVPs often participate in discussions.
- Microsoft Power BI blog: The official blog of Power BI by Microsoft. Regularly updated with official announcements, feature highlights, and case studies. Ideal for staying informed about the latest in the Power BI ecosystem.
- Power BI Tips: A community-driven website with a focus on Power BI tips, tricks, and best practices. Users can contribute their tips, access tutorials, and stay updated on the latest Power BI news.
Additionally, explore online forums, blogs, and communities where Power BI enthusiasts share tips, tricks, and best practices.
Realizing the potential of Power BI
In this Power BI step-by-step guide, we have summarized the software’s fundamentals for data analysis and reporting. From navigating the UI to creating interactive dashboards and performing advanced analytics, you should now be able to use the Power BI suite of services to their full potential.
We recommend building on this introductory information by experimenting with datasets and visualizations and creating informative reports and dashboards. You can even use these sample Power BI templates to familiarize yourself further with the software’s capabilities.
Overall, Power BI is a versatile and powerful tool for organizing and presenting business data. It also offers comprehensive analytics features and seamless integration with other Microsoft products—all in an intuitive and accessible user interface.
Mastering Power BI puts you at the forefront of modern data analysis and reporting workflows, empowering your organization with the data analytics and visualizations that inform decision-making and success.


