Key Points
- Use Data to Confirm Congestion: Prove that a network congestion is real (not a temporary slowdown) using sustained utilization, queue drops, retransmits, and flow top talker analysis.
- Localize Bottleneck by Domain: Before remediation, determine whether congestion stems from the client, LAN, WAN, ISP, or application edge.
- Stabilize Quickly with Traffic Controls: Enforce QoS, rate limiting, and off-hours scheduling to shield voice, video, and critical apps.
- Fix Root Causes with Clean Design: Segment networks, right-size links via trend data, and optimize paths using caching or compression.
- Validate Fixes with Repeatable Tests: Rerun identical measurements and compare utilization, drops, latency, and jitter.
- Prevent Recurrence with Proactive Monitoring: Maintain continuous visibility with flow analysis and monthly trend reviews to detect and tune emerging congestion.
Network congestion is among the most common and disruptive performance issues faced by many managed service providers (MSPs). It can slow down applications, cause choppy calls, and create a poor experience for end users. To keep things running smoothly, it needs to be managed with a structured, data-driven approach.
This guide provides a practical step-by-step workflow for network congestion troubleshooting. It covers confirming the issue and applying targeted controls to resolving the root cause and maintaining ongoing visibility through reporting.
How to fix network congestion
Fixing network congestion involves more than just adding bandwidth or fixing control issues. The solution should follow a structured process that identifies where congestion occurs, applies quick stabilizing measures, and addresses root causes through better design and policy. See the steps for creating a repeatable workflow below.
📌 Prerequisites:
- A monitoring platform for centralized visibility on interface counters, queues, and errors
- Flow or traffic telemetry to identify top applications and endpoints
- Change control for QoS, shaping, and policy updates
- Runbooks for “heavy job” scheduling, such as backups or software distribution
- A monthly reporting cadence and a simple KPI set for congestion
Step 1: Confirm the problem with evidence
Before trying to resolve what’s causing slow performance, you must first confirm that network congestion is actually occurring. This ensures that you are not simply assuming that there are issues and instead backing up the perceived problem with hard evidence.
Goal: Replace hunches with data to establish proof that congestion exists and is really affecting users or applications.
Make sure to do the following actions:
- Monitor sustained interface utilization: Collect utilization, queue depth, drop counts, error rates, and retransmits over a continuous 15- to 30-minute window to distinguish temporary spikes from persistent overuse.
- Analyze flow data: Use NetFlow or similar telemetry to identify “top talkers” by application, host, and conversation to see which traffic consumes the most bandwidth.
- Correlate with time patterns: Record when congestion occurs (e.g., lunch hours, end-of-day backups, patch deployments) to find recurring spikes related to user or system activity.
Outcome: A clear, data-backed view of which links, applications, and time windows are affected by congestion
Step 2: Localize the bottleneck by layer and domain
Once you know there’s congestion, the next step is to find exactly where it’s happening. This ensures you address the actual cause of the issue rather than applying ineffective fixes. Check each network layer and domain systematically, from client access through WAN and app edges, to isolate the component or policy creating the slowdown.
Goal: Find where capacity or policy is failing for more precise remediation.
In this step, check the following areas:
- Client and access layer:
- NIC (network interface card) speed and duplex settings
- Wi-Fi signal strength and interference
- Local backup or sync tools
- LAN and distribution layer:
- Oversubscribed uplinks or misconfigured switch trunks
- MTU (maximum transmission unit) settings
- VLAN (virtual local area network) hot spots or excessive broadcast traffic
- WAN or ISP layer:
- Undersized circuits
- Bursty SaaS or cloud traffic
- Path asymmetry between upload and download routes
- Application edge:
- CDN (Content Delivery Network)
- Proxies
- Load balancers
- Data center choke points
- Noisy microservices
Outcome: A clearly defined fault domain (usually one or two layers) where congestion originates
Step 3: Stabilize quickly with traffic controls
Once you identify the bottleneck, prioritize stabilizing the network and restoring performance for critical users and applications. Focus on immediate relief to ensure business-essential services function smoothly while you are investigating deeper root causes. This should also help quiet the noise, reduce user complaints, and buy time to plan a more durable fix.
Goal: Protect business-critical experiences while fixing the real problems.
Consider these tasks:
- Apply QoS (Quality of Service) marking and priority queues: Classify and prioritize real-time or mission-critical traffic (e.g., VoIP, conferencing, financial transactions).
- Throttle nonessential traffic: Use rate limiting to control low-priority and bandwidth-consuming activities such as backups, file syncs, or large software updates.
- Reschedule heavy jobs: Move data-intensive processes like patching or content replication to off-hours, or stage files locally to avoid creating bursts that overwhelm WAN links.
- Enforce metered-connection policies: Prevent roaming endpoints or remote users from saturating limited links by enforcing policies that restrict large uploads or downloads.
Outcome: User-facing applications regain stability, service degradation eases, and monitoring alerts drop significantly during peak hours
Step 4: Fix root causes with design and policy
Now, you must focus on eliminating the root cause of congestion. You want to address the underlying design and policy factors that allow congestion to recur. In this step, you shift from reactive response to proactive optimization, ensuring the network’s architecture, capacity, and usage policies align with business demands.
Goal: Eliminate systemic drivers of congestion that create recurring bottlenecks.
To address the root cause, do these actions:
- Segment networks intelligently: Separate high-volume systems or workloads (e.g., backup domains, media servers, or development labs) from production traffic. This limits east-west chatter and ensures localized bursts don’t impact the entire environment.
- Right-size links using trend data: Upgrade or reallocate bandwidth based on sustained utilization trends rather than isolated peaks.
- Optimize application delivery paths: Introduce caching, compression, or edge termination where needed to reduce redundant traffic and improve response times.
- Define and enforce usage policies: Create clear documentation for acceptable network use, including when heavy data transfers or patch jobs can occur to prevent users and systems from reintroducing contention.
Outcome: A leaner, more resilient network design that supports sustained workloads without chronic hotspots
Step 5: Prove the fix and prevent recurrence
Finally, prove that your implemented fixes worked and can endure over time. This will close the loop on congestion management, ensuring continuous performance assurance. You want to re-measure, validate, and report results to demonstrate tangible value to clients and prevent the same issues from resurfacing.
Goal: Verify improvement and ensure benefits are sustained.
Don’t forget to do these tasks:
- Re-run baseline measurements: Repeat the same data collection as before and compare utilization percentiles, drop rates, latency, and jitter before and after the fix to confirm measurable improvement.
- Validate traffic behavior: Monitor flow data to ensure top talkers remain consistent and that QoS policies are marking and queuing traffic as intended.
- Publish a monthly scorecard: Share key metrics with stakeholders, such as links exceeding target utilization, time to relieve congestion, and recurring offenders by site or application, to reinforce accountability and transparency.
Outcome: Clear, data-backed proof that performance has improved and a feedback loop that sustains network health over time
What is network congestion?
Network congestion occurs when the demand for bandwidth exceeds the available capacity on a network link or device. When this happens, users and applications experience delays, packet loss, and overall poor performance. Congestion is often caused by consistently high utilization, misconfigured network policies, or bandwidth-intensive applications.
Common signs of network congestion include:
- High latency (slow response times)
- Jitter (inconsistent delay in packet delivery)
- Packet drops or frequent retransmissions
- Noticeable slowdowns during peak usage periods
NinjaOne integration
You can plug the steps above into NinjaOne to automate evidence collection, respond faster, and maintain performance from a single platform. With NinjaOne’s various capabilities, teams can move from reactive troubleshooting to proactive and policy-driven network optimization.
| Function | How NinjaOne helps | Outcome |
| Evidence collection | Schedule automated interface and device health polling, collect flow or traffic summaries, and attach diagnostic snapshots directly to tickets. | Technicians receive data-driven proof of congestion without manual effort, speeding up triage and documentation. |
| Automated first response | Deploy QoS policy updates or rate-limit scripts automatically during peak windows and log all changes with timestamps. | Immediate stabilization of critical services with full audit visibility. |
| Heavy job governance | Coordinate patching, backup, and software distribution through change tickets, enforcing off-hours execution policies. | Prevents bandwidth saturation from scheduled maintenance or distribution jobs. |
| Reporting | Generate monthly dashboards that track utilization trends, drop/error reductions, and top talker behavior per client site. | Clear visibility into ongoing performance improvements and capacity planning needs. |
Quick-Start Guide
NinjaOne can help diagnose and eliminate network congestion through several built-in tools and features:
1. Network Performance Monitoring (NPM):
- Monitors devices via SNMP, NetFlow, and Syslog.
- Tracks bandwidth usage, CPU, memory, and disk utilization.
2. Alerting & Threshold Settings:
- Set custom thresholds for CPU, memory, and bandwidth.
- Receive alerts when congestion or performance issues arise.
3. Device Health Dashboard:
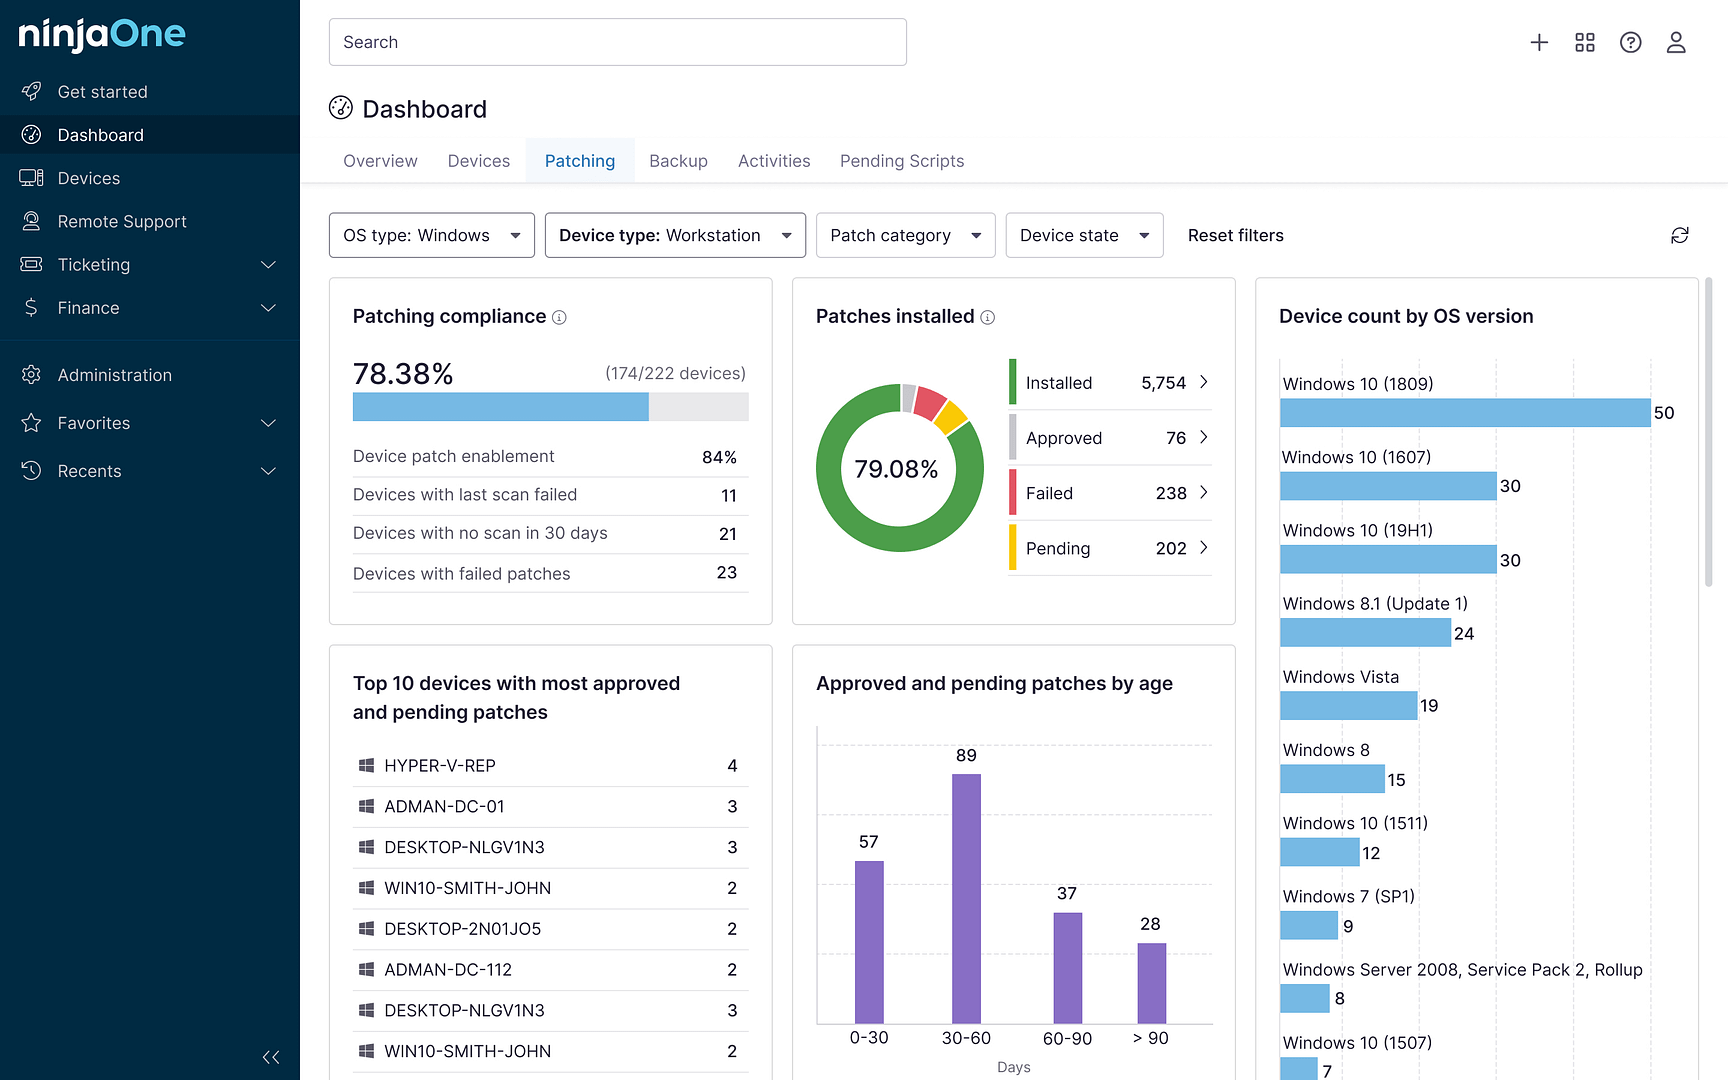
- Provides real-time insights into device health and performance metrics.
- Identifies bottlenecks quickly through visual dashboards.
4. Remote Access & Troubleshooting:
- Use remote desktop access to investigate congested endpoints.
- Run diagnostics like
ping,tracert, andnetstatdirectly from the NinjaOne console.
Steps to Diagnose Congestion with NinjaOne:
1. Enable NPM and configure SNMP/NetFlow.
2. Set thresholds for CPU, memory, and bandwidth.
3. Monitor live metrics on the Devices tab.
4. Check Alerts for congestion triggers.
5. Remediate via remote access or policy adjustments.
A smarter approach to network congestion for MSPs
Effective network congestion management should be about building a sustainable, data-driven cycle of detection, correction, and prevention. By following the steps discussed, MSPs can transform unstable networks into predictable, high-performing environments. Just remember that business demands evolve over time, which requires continuous monitoring and improvement.
Related topics:


