No one enjoys drinking from a firehose. But with so much data to choose from, how do IT service providers determine what IT metrics and operational KPIs matter most?
When most people think of IT, they think of its traditional role in managing and maintaining network infrastructure, including hardware, software, and related support. When it comes to providing measurable value to an organization, however, modern IT departments and IT providers are expected to deliver key results in several areas, including:
- Adding new technical functionality and solutions
- Maintaining a productive workforce
- Managing costs
- Leveraging new technology when it becomes available (sometimes referred to as the ‘transformational’ role of IT)
Identifying the right metrics to track performance and impact across these efforts is obviously key to achieving success (not to mention rationalizing the budget). Otherwise, without metrics or key performance indicators (KPIs), organizations inevitably struggle to gauge performance and adjust when goals are not reached.
How to measure success in IT
Discover actionable formulas and tips for measuring the success of your IT environment.
Why is it important to track IT metrics?
IT metrics measure your organization’s performance and success. This, in turn, allows you to make more informed decisions and data-driven adjustments to maximize your business processes and improve your operational efficiency.
Think about it this way: When you ask your stakeholders to change a policy or their opinions about a certain strategy, they will inevitably ask you for data.
Why do we have to perform a certain action?
Why do we need a specific technology?
Why must we do this or that?
Essentially, your IT metrics answer the “why” of all your business decisions, giving you tangible measurements of any business operation. IT metrics also establish clear benchmarks for evaluating your performance and identifying areas for improvement.
You need IT metrics to determine the effectiveness of your strategies and projects—and add more value when you report back to your stakeholders, investors, and customers.
What IT metrics should you be tracking?
The majority of IT teams don’t struggle from a lack of metrics and dashboards, but too many of them. Alert fatigue is real, and without a “single pane of glass,” actionable data can blend into the noise and fall through the cracks.
That’s unfortunate, because, as the example below shows, efficient IT operations often rely on proactively observing minor performance issues before they become large issues.
Let’s say the IT team notices an application’s online performance drops noticeably in a short amount of time. The performance change is minor enough that users may not even notice it, but it does get picked up in the team’s dashboard.
This prompts the IT team to investigate, and they discover that one of the organization’s teams installed unauthorized software that conflicted with the application. The unauthorized install isn’t causing any other issues — yet — but thanks to proactive monitoring, the IT team is able to track it down and eliminate the problem before it compounds.
By tracking the right metrics and using the appropriate or best IT reporting tools and dashboards, IT providers can proactively address symptoms like this, and take command of IT operations.
NinjaOne’s IT operations management (ITOM) software consolidates your IT management stack into a single platform.
Meet your KPIs more efficiently today.
6 examples of IT efficiency KPI metrics
There is no single master list of metrics that are right for every organization, but here are a few examples that many teams do actively track:
1. Service availability: Is IT delivering on promises and timelines? Is maximum uptime and usability being achieved while minimizing risk and costs? Are service outages being avoided and critical systems kept in optimal condition?
2. Mean time to resolve (MTTR): What is the average time taken to resolve a service ticket?
3. Mean time between failure (MTBF): What is the average time between IT system failures?
4. Mean time to failure (MTTF): What is the usual system uptime after the last issue has been resolved?
5. First call resolution (FCR): What percentage of requests are resolved during the first point of contact?
6. Customer satisfaction (CSAT): How satisfied are your customers with the service provided to them?
15 examples of IT operations KPI metrics
Just as there are dozens of potential efficiency metrics, there are countless IT KPIs that you could track. Here are a few examples of metrics that fall under this category:
1. Online application performance: Based on loading or rendering times for the individual piece of software or cloud app.
2. Online application availability: How often is the application running correctly and available to the users who need it? How does operating availability differ during various parts of the day? How about outside of business hours?
3. Production incidents: The number and severity of production issues.
4. Batch SLAs met: Have key batch jobs completed on time?
5. ITSM and Service Desk: How is service availability and resolution speed?
6. System uptime and reliability: How dependable are your IT systems? This includes measuring downtime incidents compared to server uptime.
7. Security incidents: How many security breaches or incidents have occurred in your IT network?
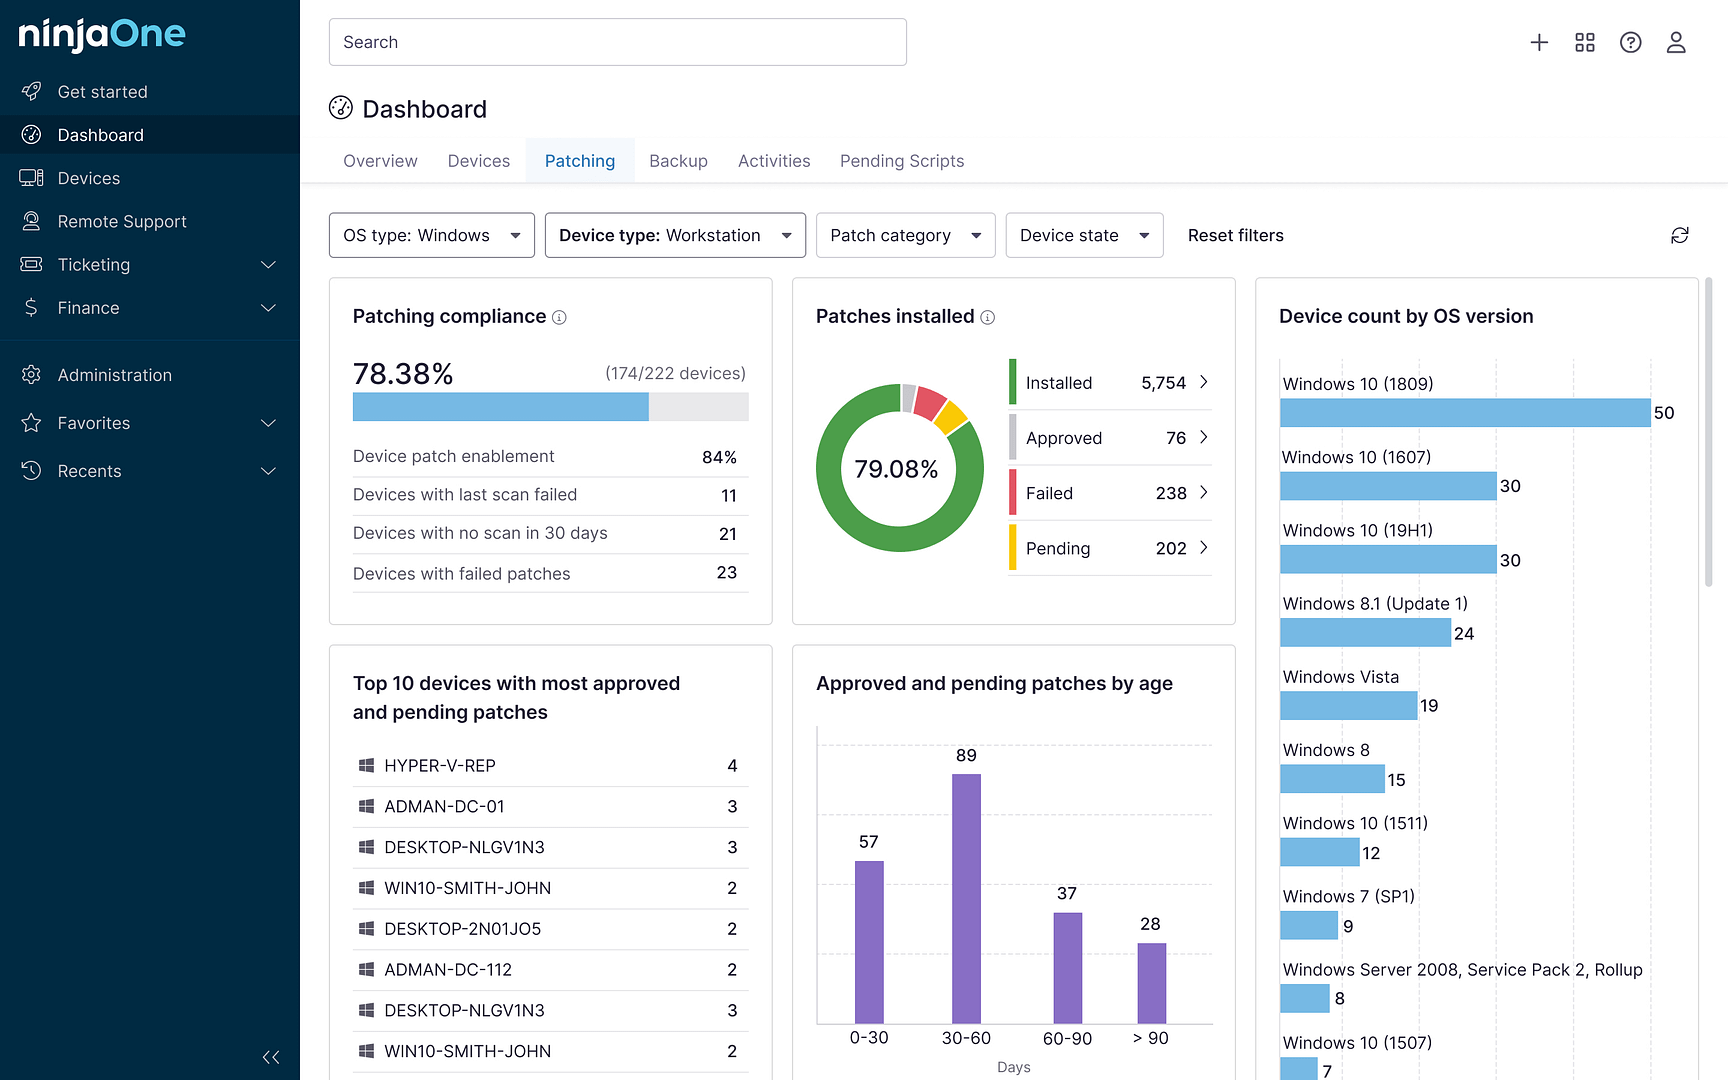
8. Patching compliance: What percentage of systems are up-to-date with their patches?
9. Compliance score: How compliant is your IT system with industry and regulatory standards, such as the GDPR and HIPAA?
10. Backup success rate: How confident are you in your backup software? This also includes tools for data recovery.
Protect your data in case of a major technical issue with NinjaOne’s Data Recovery software.
11. Recovery time objective (RTO): What is the maximum tolerable time your IT system can be down after a failure?
12. Recovery point objective (RPO): What is the most acceptable data loss in case of a failure or disaster?
13. IT budget variance: What is the difference between your actual IT expenses and your IT budget?
14. Return on investment (ROI): How effective and efficient are your IT projects?
15. Total cost of investment (TCO): How cost-effective are your IT assets throughout their entire lifecycle?
3 examples of IT employee productivity metrics
1. User adoption rates: How fast do your employees adopt and use IT tools and solutions/
2. Application responsiveness: How smoothly do your applications function as needed for maximum employee productivity?
3. Employee downtime: How long is the average downtime of an employee’s workstation when IT assets are unavailable? Keep in mind that downtime should not occur as much as possible.
These are only a handful of examples in a sea of options. After all, any data that can be recorded can be tracked. Below, we’ll discuss how to determine which metrics to focus on.
Choosing IT operational KPIs: Best practices
With data being so plentiful, it can be tempting to produce extensive reports that cover virtually every aspect of the IT environment or service. Since so many things can be tracked, this usually results in hefty, multi-page reports that are very unlikely to be read by anyone outside of the team that produced them.
It’s important to track and report on metrics that map back to business value and that are understandable to the leadership team that you’re reporting to. Always think of your audience first, and consider their perspective before compiling reports.
6 best practices for selecting and reporting on IT KPIs:
- Be selective: Creating an effective IT management report is all about selecting the best key performance indicators for the intended reader. If you’ve taken time to align your departmental goals and values with those of the organization as a whole, then choosing these operational KPIs should be relatively straightforward.
- Avoid duplication: Remember that you’re trying to avoid “data overload.” Keep everything as simple as possible and avoid duplicating data or presenting unnecessary overlap, if possible.
- Use templates: You don’t want to spend too much time on reporting. It takes time away from actual work. Most solutions have templates that will make it easy to create presentable reports quickly. As your own team spends time refining your reporting process, you can develop your own internal templates that better suit your needs.
- Make reports skimmable: Include a single-page executive summary and leverage headings and visuals to make the report’s narrative and priorities as clear as possible, even at a glance.
- Automate when you can: Again, you want to streamline reporting as much as possible. Use automation whenever and wherever you can in the data collection, report generation, alerting, and report delivery process.
- Share on multiple devices: Providing access to IT reports on multiple devices (including phones or tablets) can help avoid accessibility issues and make it easier to share reports with everyone in the organization.
What should IT reports & IT operations scorecards look like?
At a very high level, an IT report should compile KPIs tracked over a certain period to assess various situations related to costs, risks, project management, and helpdesk issues (tickets and resolutions). For some example visuals, see this post from Datapine.
Additional recommendations: Don’t shy away from being timely and leveraging tool dashboards
While it’s common for IT reports to be delivered monthly or even quarterly, the best practice is to keep leadership informed of notable IT issues as they occur rather than waiting for scheduled report times. Modern monitoring tools let you provide real-time dashboards to management when necessary — use them.
Speaking of tools, much of what we’re discussing takes place within an operational dashboard/tracking system. An IT operations dashboard is used for monitoring and managing operations, logging these metrics, and weighing them against the selected operational KPIs.
Benefits of IT operations management software and tools
Effective management of modern IT environments requires access to tools that go well beyond basic metrics and insights alone. Real-time, interactive data reports are becoming table stakes, especially when they’re integrated with other important IT management tools.
Delivering robust IT support to your end-users will determine the success and ongoing performance of your entire business, and the right data and operational KPIs will get you there.
Technical reports with data provided by ITOM software and tools will help you:
- Find and tackle anomalies before they become issues
- Improve the departmental structure
- Make daily, weekly, and monthly decisions with confidence and clarity
By understanding what you need to do to create effective reports, and by fully leveraging tools such as NinjaOne, you will truly empower your IT team or MSP, and accelerate the success of everyone you serve in the process.
Ready to improve your visibility and automate your most time-consuming IT tasks? See how NinjaOne’s platform can make your team more effective.


