Key points
- Why Hardware Health Monitoring Matters: Proactively track CPU, RAM, disk, and storage performance to prevent downtime, avoid data loss, and maintain compliance in enterprise IT environments.
- Role of RMM Platforms: Remote monitoring and management (RMM) tools like NinjaOne, N-able, Atera, and Datto RMM provide real-time visibility into device health, early detection of failures, and automated alerts.
- Essential Hardware Health Metrics: Monitor CPU usage and temperature, memory availability, disk SMART status and capacity, and long-term storage utilization trends for accurate performance insights.
- RMM Prerequisites: Deploy an RMM agent to endpoints, ensure administrator privileges, enable PowerShell support, and optionally use WMI, WinRM, or SNMP for extended monitoring on legacy systems.
- Methods to Monitor Metrics Using RMM:
- Native RMM Policies: Use built-in monitoring templates to set thresholds for CPU (>85%), RAM (>90%), disk space (<10%), and SMART drive failures, with automated alerts and remediation.
- PowerShell Scripts: Query CPU, memory, and disk health directly, log events for high resource usage, and integrate with RMM tools for centralized event monitoring and automated responses.
- Command Prompt Monitoring: Collect CPU, memory, and disk metrics via Tasklist, Systeminfo, and WMIC; write alerts to log files for lightweight, legacy-compatible monitoring.
- Group Policy Enforcement: Configure centralized logging and performance alerts via Group Policy Management for domain-connected Windows devices.
- Common Challenges: Watch for inactive RMM agents, script permission issues, missing data, false positives, and log retention gaps. Optimize thresholds to reduce alert fatigue.
- Advanced Considerations: Extend monitoring to virtual environments (host + VM performance), mobile devices with limited access, and lightweight endpoints sensitive to frequent polling.
This guide provides examples for IT administrators and managed service providers (MSPs) to monitor client hardware health metrics using remote monitoring and management (RMM) platforms.
It includes advice as well as example PowerShell scripts that can be used to create automated health checks consistent across devices, providing information that can be used to send alerts when critical thresholds are reached.
Undetected hardware degradation leads to unexpected downtime and costly repairs.
Why you need to remotely monitor client hardware health in enterprise environments
Businesses depend on their IT infrastructure. From underspecced devices running out of resources (for example, insufficient RAM, disk space, or a weak CPU), to hardware failures and damaged devices, monitoring hardware health allows you to proactively solve end-user problems and ensure that productivity isn’t affected. Hardware failure can also lead to more detrimental problems, such as data loss, which could result in real damage to your business and potential compliance issues.
Using RMM platforms to remotely monitor client hardware health provides MSPs with real-time visibility into how their clients’ devices are performing, allowing them to detect early warning signs of insufficient or failing hardware, solve problems before they have an impact, and enhance their reputation with their business customers.
The key hardware health metrics you should monitor include:
- CPU usage and thermal status
- Memory (RAM) usage and availability
- Disk health (SMART status, capacity thresholds, I/O errors)
- Storage utilization trends
To set up active client hardware health metrics with your chosen RMM platform, you’ll need:
- An active RMM platform (for example: NinjaOne, N-able, Atera, or Datto RMM)
- RMM agent deployed to target endpoints
- Administrator privileges for script execution
- PowerShell support on monitored endpoints
You can also optionally leverage WMI, WinRM, and/or SNMP (for legacy systems) access for extended hardware data collection.
Method 1: Using RMM native hardware monitoring templates
Most RMM platforms provide policy templates for monitoring hardware health and resource utilization. The details will vary between RMM products, but will broadly follow these steps:
- Navigate to Monitoring Policies or Condition Templates in your RMM tool
- Create or modify a template to include:
- CPU usage threshold (e.g., >85% for 5 minutes)
- RAM usage threshold (e.g., >90% of physical memory)
- Disk free space threshold (e.g., <10% on system volume)
- SMART failure detection for supported drives
- Set actions to take on a threshold breach, such as sending an alert, running a remediation script, or opening a support ticket
- Assign template to devices, groups, or sites
By using your RMM platform to deploy policies, you can ensure that monitoring across all clients is standardized, and covers all required metrics.
Method 2: Using PowerShell to query hardware metrics
If your RMM does not support collecting the required metrics, or if you wish to script your own solution entirely, you can use PowerShell to access granular real-time hardware information.
Check CPU usage in PowerShell by running the command:
(Get-Counter ‘\Processor(_Total)\% Processor Time’).CounterSamples.CookedValue
Check available memory by running the command:
Get-CimInstance -ClassName Win32_OperatingSystem | Select-Object FreePhysicalMemory, TotalVisibleMemorySize
Check disk free space and health by running:
Get-PSDrive -PSProvider ‘FileSystem’ | Select-Object Name, Used, Free
Get-WmiObject -Namespace root\wmi -Class MSStorageDriver_FailurePredictStatus | Select PredictFailure
If an issue is detected, you can then generate a Windows Event Log. This example shows raising a log if high CPU usage is detected:
if ($cpu -gt 85) {
Write-EventLog -LogName Application -Source “HardwareMonitor” -EventID 1501 -EntryType Warning -Message “High CPU usage detected”
}
By writing to the Windows Event Log, you can utilize RMM or other monitoring tools to track specific events, providing a centralized location to monitor for these events.
Method 3: Using Command Prompt to poll resource stats
The Windows Command Prompt can be used for basic hardware monitoring, useful in legacy environments, or small deployments where less detail is required.
Check CPU load (Tasklist sample):
tasklist /FO TABLE >> C:\Logs\task_snapshot.txt
Inspect memory usage:
systeminfo | findstr /C:”Available Physical Memory”
Check disk space:
wmic logicaldisk get size,freespace,caption
If an issue is detected, it can be written to a log file (this example shows writing a low disk space warning to a text file):
for /f “skip=1 tokens=2” %%A in (‘wmic logicaldisk where “DeviceID=’C:'” get FreeSpace’) do (
if %%A lss 10737418240 echo Low disk space >> C:\Logs\disk_warning.log
)
You can then use your RMM or other monitoring agent to watch for changes to these log files.
Method 4: Using Group Policy to enforce logging and resource alerts
Windows Group Policy allows you to centrally configure domain-connected Windows 10 and Windows 11 devices, including enabling performance logging:
- Open Group Policy Management Console
- Navigate to Computer Configuration > Administrative Templates > System > Performance Logs and Alerts
- Configure the individual settings for Data Collector Sets, Logging policies for CPU, memory, disk, and Audit settings for low disk events
IT staff wastes hours manually checking device statuses across their networks.
Additional considerations and troubleshooting
When building scripts to feed device health data to your RMM solution, consider virtual environments as well. Both host-level performance and the performance of virtualized hardware can be monitored.
Consider the type of device you wish to monitor as well. Mobile devices may limit direct hardware access, while some storage devices may not support SMART. Additionally, lightweight devices may have their performance affected by heavy RMM/monitoring clients or too frequent polling.
Common failures in remote client hardware health monitoring include missing data (often due to an inactive RMM agent), script failures resulting from insufficient permissions, inadequate log retention, and thresholds that lead to false positives.
Beyond hardware health monitoring with intelligent RMM tools
RMM by NinjaOne provides robust remote hardware monitoring without the need for complex script configuration. It includes hardware monitoring policies for tracking CPU, RAM, and disk usage with threshold-based alerts, SMART status support for proactively identifying data storage failures, custom scripting, alert-based automation, and device inventory (including collecting hardware specifications).
Everything is reported and managed through a central web dashboard, featuring unified alerts via email or push notifications, so that hardware issues are detected before they can result in data loss or impact productivity. For MSPs, this enables them to scale up and manage more clients, including more devices, while maintaining efficient and focused teams.
Quick-Start Guide
NinjaOne provides robust hardware health monitoring capabilities through several features:
1. Device Health Monitoring
– The dashboard offers a comprehensive Device Health Issues widget that tracks:
– Servers currently down
– Devices with active threats
– Devices with failed/pending patches
– Devices with specific conditions
– Pending reboots
– Backup job statuses
2. Performance Metrics
– NinjaOne can monitor system performance, including:
– CPU usage
– Memory utilization
– Disk performance
– Network metrics
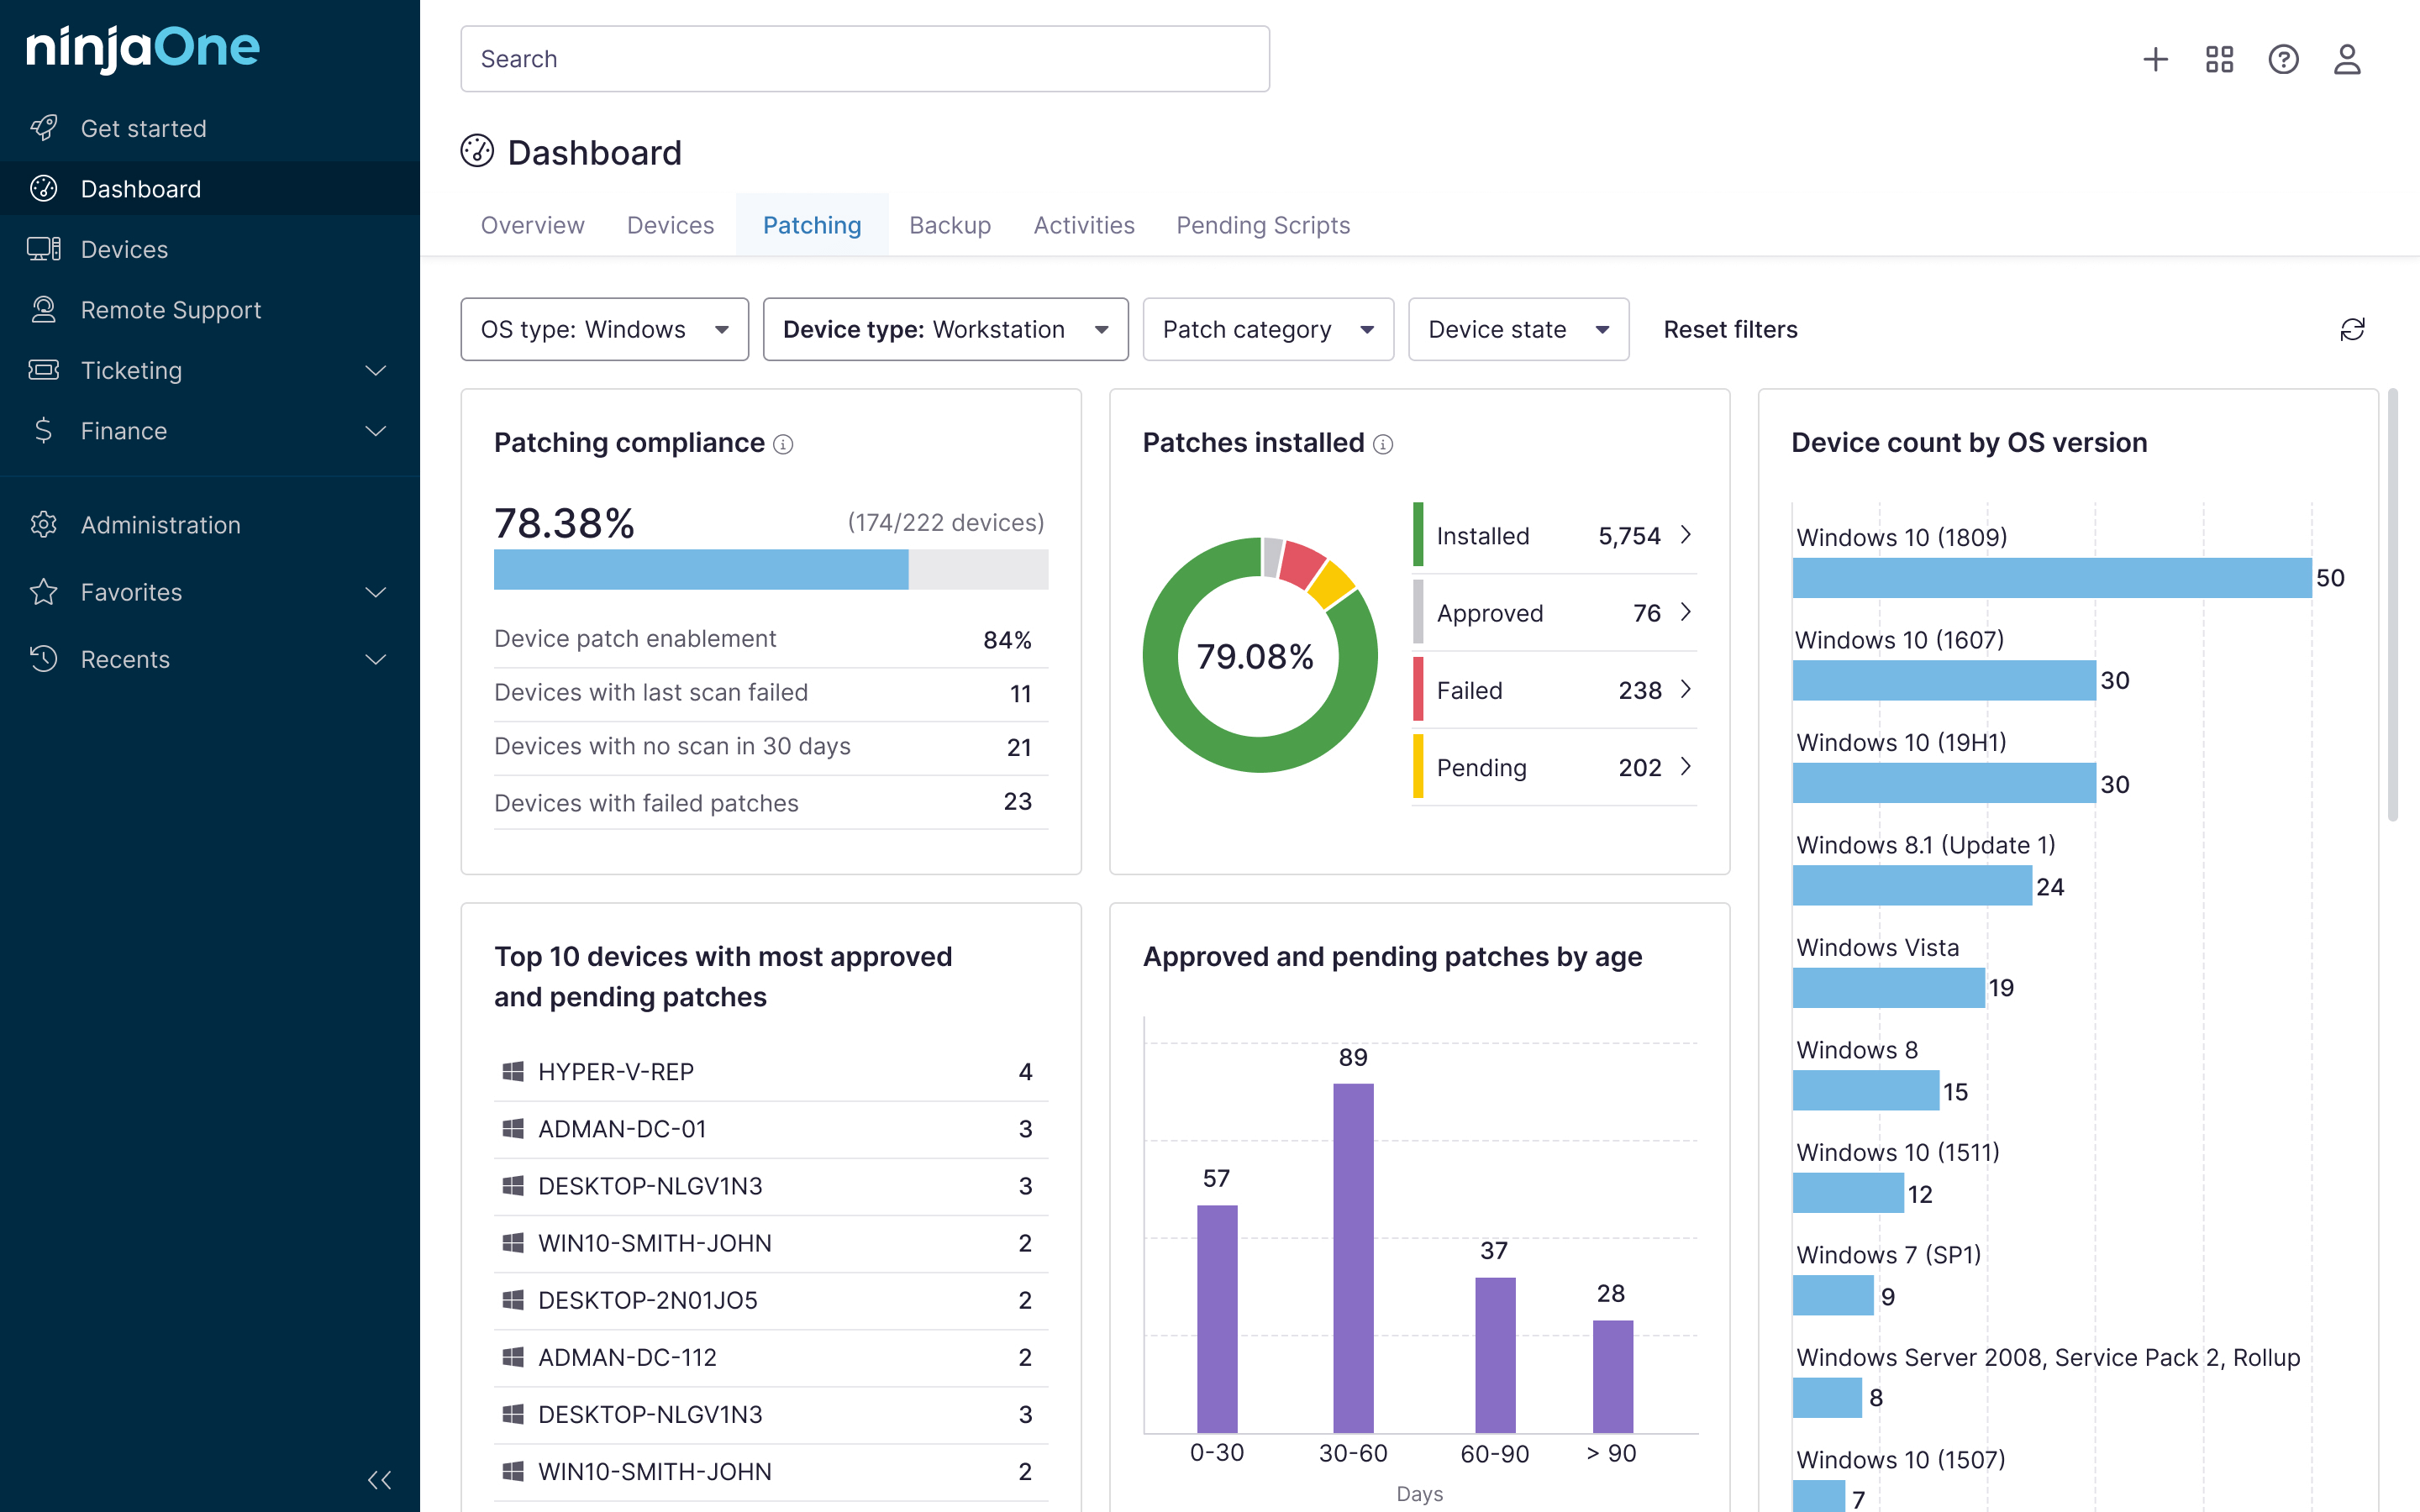
3. Patch Management
– Detailed patch management dashboard shows:
– Patch installation status
– Failed patches
– Patch compliance
– Vulnerability data
4. Network Management
– Network Management System (NMS) allows monitoring of:
– Network device health
– Device uptime
– Configuration backups
5. Automated Monitoring
– Supports creating custom conditions and alerts
– Can generate notifications based on specific hardware health thresholds


