Organizations typically outsource network health checks to an MSP to ensure 24/7 monitoring and proactive remediation. To meet these demands, MSPs rely on specialized tools and strategies to detect problems before an incident occurs. This guide explains how to build a scalable, resilient, and cost-efficient auditing framework that can be used to perform consistent quarterly network reviews.
Network health check template structure
MSPs and clients usually agree on a quarterly template that covers the essentials of the latter’s network environment. This document is then reviewed based on new parameters and performance. Below are some of the core components to include in your template.
A. Inventory and documentation review
A thorough review allows MSPs to leverage existing tools and efficiently integrate new solutions. This auditing window should also be used to ensure the documentation matches the actual gaps in the IT environment. Here are some steps to consider:
- Audit routers, switches, firewalls, servers, and endpoints.
- Update network diagrams to reflect the current environment.
- Select an IT management tool that scales with business needs.
- Identify any “shadow IT” devices or systems that may have been overlooked.
Recommended tools or strategies: RMM tools provide a seamless workflow for discovering devices and managing inventory lists.
B. Performance metrics
Upon verifying the network assets and resources, a metric should be established to measure their performance using strict criteria.
Here are some key evaluation areas to consider:
- Latency – High latency can disrupt real-time tools such as remote access software or live collaboration platforms.
- Packet loss – Packet loss, even in small amounts, can reduce VoIP call quality or delay automated system updates.
- Bandwidth utilization – Bandwidth utilization insights help determine whether current capacity supports tasks like large file transfers or software deployments.
- Throughput analysis – Throughput analysis verifies whether the network can sustain operations such as centralized patching or backup processes.
- Error rates – Error rates may signal hardware degradation or misconfigurations that impact endpoint performance.
In addition, the template should outline application-level monitoring to observe how business-critical apps such as Microsoft 365, VoIP systems, or CRM platforms perform over the network.
Recommended tools or strategies: Network monitoring solutions can collect data, which can be analyzed against historical performance logs and quarterly baselines. These insights support proactive troubleshooting and long-term infrastructure planning.
C. Security and configuration validation
Security checks are essential for building a resilient strategy against evolving threats, as they help prevent vulnerabilities and maintain system integrity across client environments
Some items that MSPs are expected to validate include:
- Patching levels and firmware updates
- Firewall rules, VPN configurations, and ACLs
- Unsupported and legacy systems
These components should be monitored and validated regularly to mitigate surface attacks and optimize performance. That said, legacy software usually requires additional bandwidth since it typically has vulnerabilities that cannot be patched.
Recommended tools or strategies: A combination of built-in Windows tools, enterprise IT software, or an RMM can automate security and configuration management.
D. Connectivity and network integrity
Quarterly audits provide a timely window to check network stability and integrity. The workflow for this stage includes running ping or traceroute tests across critical nodes and confirming link redundancy and VPN tunnel stability.
Recommended tools and strategies: For baseline objectives, IT administrators can use built-in utilities such as ping, tracert, or pathping for quick diagnostics. Specialized tools can then be used to audit VPNs and advanced network settings.
E. Backup and redundancy review
Backup systems must be routinely tested to ensure they can support recovery in the event of an incident. Backup schedules should be reviewed regularly and adjusted as needed to stay aligned with organizational policies. In addition, test restores should be performed to verify that backup protocols are functioning as expected.
Recommended tools and strategies: Cloud-first backup solutions play a crucial role in minimizing downtimes and meeting compliance. For scalability and reduced overhead, RMM platforms can provide integrations that consolidate backup systems and IT management in a single console.
F. Incident readiness and logging
To piece it all together, the quarterly checklist needs to account for the overall readiness of the network. To validate the system’s response capabilities, consider the following:
- Ensure antivirus/EDR solutions are up to date with the latest signatures.
- Validate that centralized logging is enabled for auditing and compliance.
- Check whether alerts are actionable and have clear escalation paths.
- Review logs from the past quarter, including incidents, alerts, and PSA tickets.
This stage should determine the resilience of the network and systems when incidents occur. It also scrutinizes logging and auditing protocols, which usually indicate how fast the remediation and recovery processes will be in the wake of security events.
Recommended tools and strategies: Ticketing systems within PSA platforms improve organizational accountability by aligning technical actions with business records.
Automating network health check
Automation transforms quarterly reviews from labor-intensive projects into a streamlined and sustainable workflow. With scripts and policies, MSPs can scale network health checks across many clients without losing accuracy.
Example: Check uptime and patch status via PowerShell
This script pulls data about the recent patch and the system’s uptime in days.
if (-Not (Test-Path "Clients.txt")) { "localhost" | Out-File "Clients.txt" }
$clients = Get-Content "Clients.txt"
$result = foreach ($c in $clients) {
$uptime = (Get-CimInstance -ComputerName $c Win32_OperatingSystem).LastBootUpTime
try {
$patch = Invoke-Command -ComputerName $c -ScriptBlock { Get-HotFix -Id "KB5011497" -ErrorAction Stop }
} catch {
$patch = $null
}
[PSCustomObject]@{
Client = $c
UptimeDays = (New-TimeSpan $uptime (Get-Date)).Days
PatchApplied = if ($patch) { "Yes" } else { "No" }
}
}
$result | Export-Csv "QuarterlyHealthCheck.csv" -NoTypeInformation
💡 Note: Please replace the current KB value (e.g., KB5011497) with the specific KB you want to verify across clients. Meanwhile, to identify installed updates on a reference system, run: Get-HotFix.
Example: Perform a compliance check via GPO
This action audits the compliance status of a single endpoint. You may use GPMC to repeat the process at scale.
gpresult /S COMPUTERNAME /h GPOComplianceReport.html
💡 Note: Replace “COMPUTERNAME” with the actual hostname of the endpoint you want to audit. To check the hostname, run hostname on the target machine.
Leveraging automation can help MSPs better manage IT resources and mitigate human errors. Automating workflows will also improve service delivery, incident logging, and general response times.
Packaging and delivering the network health check report
A health check’s value is only as strong as the way it’s presented to the client. Packaging findings into a clear, polished report demonstrates professionalism and reinforces trust.
A professional health check report should include the following components:
- Cover page: client name, quarter, date, author
- Executive summary: top risks, recent improvements, and high-level findings
- Detailed: grouped by each health category
- Visuals: diagrams, charts, and trendlines
- Action plan: remediation steps with timelines
- Appendix: raw logs, automation outputs, and supporting evidence
Delivering results in a structured client-facing format ensures that stakeholders not only see the technical depth of the work but also understand its business impact.
NinjaOne platform integration ideas
RMM unlocks many automation opportunities for monitoring network health and auditing incidents. For instance, these NinjaOne integrations can be used at scale across distributed endpoints:
- Track quarterly tasks via recurring maintenance tickets in the ticketing module.
- Use device and policy data from the RMM to validate patching and asset age.
- Include outputs from automation scripts, such as backup logs or registry-related checks, in the health check report.
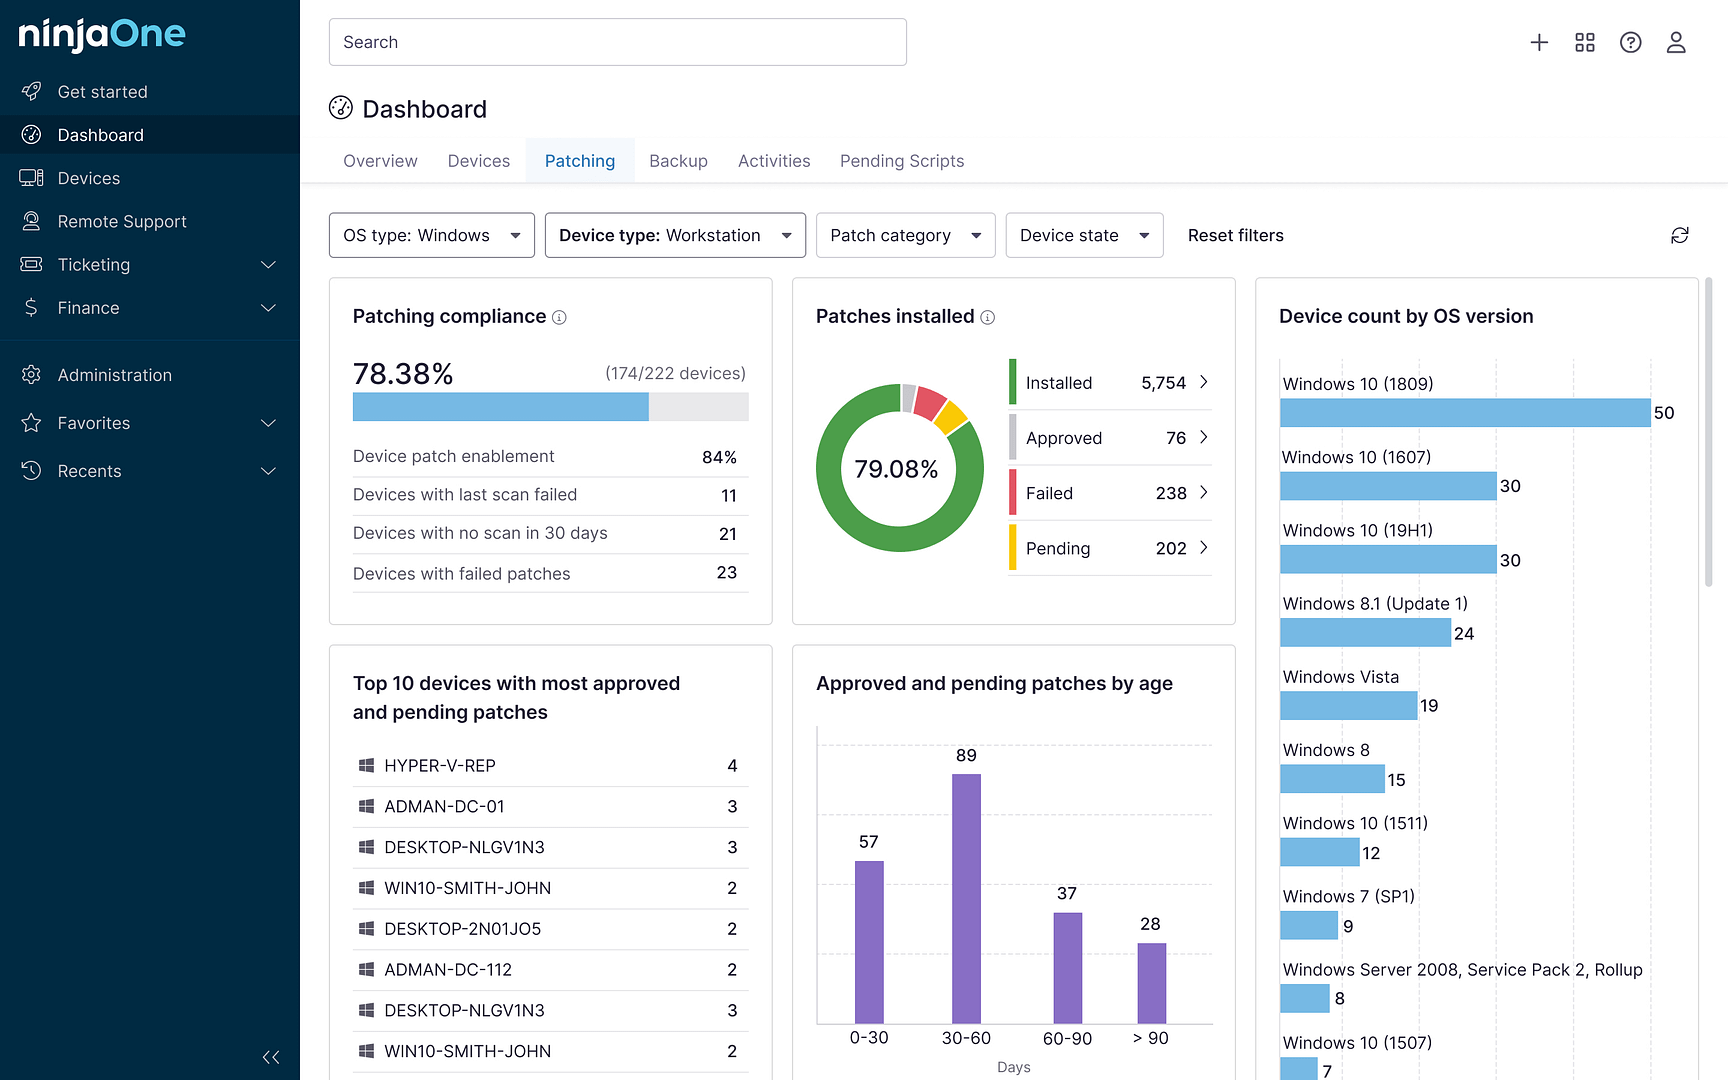
- Use NinjaOne dashboards for an organization-wide health overview, including metrics like device status, patch compliance, and alerts.
- Export data from dashboards as summary reports for client delivery, according to NinjaOne’s reporting documentation.
- Use NinjaOne’s automation engine to schedule and execute PowerShell health scripts.
NinjaOne RMM® can automate patch and software management as well as collect and present data according to specific client and compliance requirements.
Why choose quarterly network health checks
A quarterly review balances effort and visibility, which are crucial for fast-paced industries and agile IT environments. Monthly checks can be redundant if continuous monitoring tools are already in place, while annual checks can leave gaps unnoticed for longer periods.
On balance, a quarterly network audit is ideal as it easily aligns with industry compliance and business reporting cycles. With automation and predefined scripts, most reviews can be put together within a few hours, which then affords MSPs more time to package results and create a client-friendly and actionable presentation.
Related topics:
- 6 Network Monitoring Best Practices
- Exploring Network Performance Management Guide
- What Is Network Discovery?
Quick-Start Guide
NinjaOne Network Health Check Capabilities
NinjaOne offers several features that can help you create a comprehensive quarterly network health check template:
Network Monitoring Features
– Network Management Software (NMS) for monitoring devices via SNMP
– Supports monitoring various network devices like routers, switches, firewalls, and printers
– Can track key metrics such as:
– Device uptime
– CPU usage
– Memory usage
– Network adapter status
Health Check Components
You can build a template that includes:
1. Device Inventory and Status
– List of all network devices
– Device health status
– Online/offline device tracking
2. Performance Monitoring
– CPU and memory usage checks
– Network throughput
– Device performance metrics
3. Security Checks
– Vulnerability scanning
– Patch management status
– Antivirus protection status
4. Configuration Monitoring
– Network device configuration backups (supported for HP and Cisco devices)
– Changes in device configurations
Template Creation Approach
– Use NinjaOne’s NMS Policies to create specific monitoring configurations
– Set up recurring scans and checks
– Configure alerts for critical issues
– Export and report on network health status
Recommended Tools and Features
– Use Network Discovery utility to add and manage devices
– Leverage Custom SNMP monitoring for detailed insights
– Set up conditions and alerts for proactive monitoring
Quarterly Workflow
1. Run comprehensive network device scan
2. Generate health status reports
3. Review vulnerability and patch status
4. Check device performance metrics
5. Verify security configurations


