Key Points
- Link Metrics to Business Outcomes: Connect raw technical performance directly to tangible organizational impacts, framing system uptime as revenue protection, security prevention as brand reputation preservation, and infrastructure health as operational cost reduction.
- Track Executive-Relevant Data: Focus your reports on high-level financial and operational indicators that leadership cares about, including system availability, security incident prevention, infrastructure efficiency, and clear technology ROI.
- Incorporate New Value-Driven Metrics: Modernize standard reports by highlighting employee productivity gains from automation (man-hours reclaimed) and the financial benefits of SaaS optimization (eliminating duplicate “Shadow IT” software licensing costs).
- Translate Security into Financial Safeguards: Move away from raw threat-detection counts. Instead, present security updates as proactive risk management that lowers cyber insurance premiums, avoids compliance fines, and safeguards business continuity.
- Visualize Complex Information: Utilize structured visualization approaches—such as risk heat maps, single-pane KPI dashboards, and before-and-after efficiency comparisons—to help non-technical clients quickly interpret strategic trends and data relationships.
- Drive Strategic Investment Decisions: Map every IT initiative directly to a core business objective (like revenue growth or risk mitigation) and structure proposals as executive briefings that offer multi-tiered investment scenarios with clear financial analysis.
Every day, your systems generate massive amounts of operational data, but turning those metrics into actionable business insights remains a challenge. That’s where an IT executive summary report comes in. By applying the right methodologies, you can translate performance data, security metrics and infrastructure health indicators into clear, executive-level communications that show business value and guide strategic technology investments.
For a quick visual overview, watch our video guide on How to Build Executive Reports That Show IT Value to Non-Technical Clients.
Download ready-to-use templates and blueprints for your executive reports.
What is a non-technical report for executives?
Translating technical reports into non-technical language can help turn complex IT operations into business narratives that leadership can quickly grasp and act on. Instead of drowning in jargon and system details, executives can see outcomes framed in terms of organizational goals, risk management and financial performance. Your reports should highlight strategic implications over operational mechanics, positioning technology initiatives as enablers of growth and resilience rather than line-item costs.
Create compelling IT executive summary reports
The best reports position technology initiatives as direct contributors to revenue growth, operational efficiency and competitive advantage. Here’s how to transform routine system maintenance into proactive business outcomes and position infrastructure investments as growth enablers.
Focus on business outcomes
Business outcomes represent the measurable impact IT operations have on organizational performance. For example, the most efficient reports should connect:
- System uptime percentages to customer satisfaction scores
- Security incident prevention to brand reputation protection, and
- Infrastructure optimization to operational cost reduction.
You need to identify and clearly communicate specific business metrics that technology directly influences and present these connections in quantifiable terms that executives can evaluate against other business investments.
Use metrics that matter to leadership
Leadership metrics should focus on financial impact, operational efficiency and strategic positioning rather than technical performance indicators. Risk mitigation statistics, for example, can demonstrate how IT investments protect revenue streams and prevent costly business disruptions.
Consider these metrics when building your IT executive summary report:
- System availability: Show how uptime protects revenue and supports customer retention.
- Security incident prevention: Quantify reduced compliance costs and strengthened brand reputation.
- Infrastructure efficiency: Link performance gains to lower operating costs and higher productivity.
- Employee Productivity & Automation Gains: Translate automated IT fixes—like self-healing scripts or automated patch deployments—into hours of business downtime avoided or manual labor hours reclaimed for the company’s core operations.
- Technology ROI: Measure returns in terms of business growth and competitive advantage.
Speak to non-technical stakeholders
Speaking to non-technical stakeholders means you need to translate system performance data into business language that connects directly to organizational priorities. Drop the jargon and show cause-and-effect: how IT actions drive revenue, reduce risk or cut costs. Use the same financial and operational language executives rely on elsewhere so technology decisions fit naturally into broader business strategy discussions.
Gather data that tells your IT story
Data gathering for IT executive summary reports helps you identify metrics that demonstrate clear connections between IT operations and business performance. Raw system statistics don’t really tell us how different IT initiatives drive business growth. However, if you transform them into narrative elements that clearly show how your technology protects revenue, enables growth or mitigates operational risks, it can be easier to drive further investments. The collection process should focus on outcome-based indicators rather than technical performance measurements, creating a foundation for business-focused storytelling.
Provide high-level security insights
Raw threat detection numbers mean little to executives on their own. To make them relevant, translate detection and response metrics into clear business risk assessments that highlight what’s at stake. From there, show how proactive monitoring prevents financial loss, protects customer data and keeps the organization compliant. When presented this way, security investments stop looking like overhead and instead stand out as safeguards that protect critical assets and give the business confidence to grow in digital markets.
Frame these security updates not just as defense, but as a direct financial benefit. Highlight how robust, proactive security controls protect the company’s bottom line by lowering cyber insurance premiums, avoiding costly compliance penalties, and simplifying annual audit processes.
Explain system health metrics
System health metrics become far more meaningful when you present them in terms of business outcomes. Server uptime translates into reliable customer service availability, while network performance highlights how well employees can work and collaborate. By framing these indicators as measures of continuity and efficiency, you show how infrastructure health directly supports daily operations and reinforces long-term growth.
Transform technical metrics into business value
Identify specific connections between system performance and organizational outcomes. Database response times translate into customer experience metrics, while backup success rates become business continuity assurance statements that protect against operational disruptions. This involves quantifying technical improvements in terms of cost savings, revenue protection and competitive advantage creation that executives can evaluate using standard business investment criteria.
Communicating with non-technical stakeholders
Transform technical discussions into business value conversations by focusing on outcomes, ROI and strategic alignment rather than implementation details. For instance, you can frame IT initiatives as solutions to specific business challenges, using executive language around risk mitigation, competitive advantage and operational efficiency.
Use visuals to simplify complex information
Visuals simplify complex information by presenting data relationships and trends in formats that executives can quickly interpret and act upon. Select presentation formats that align with executive expectations and time constraints.
Visualization approaches include:
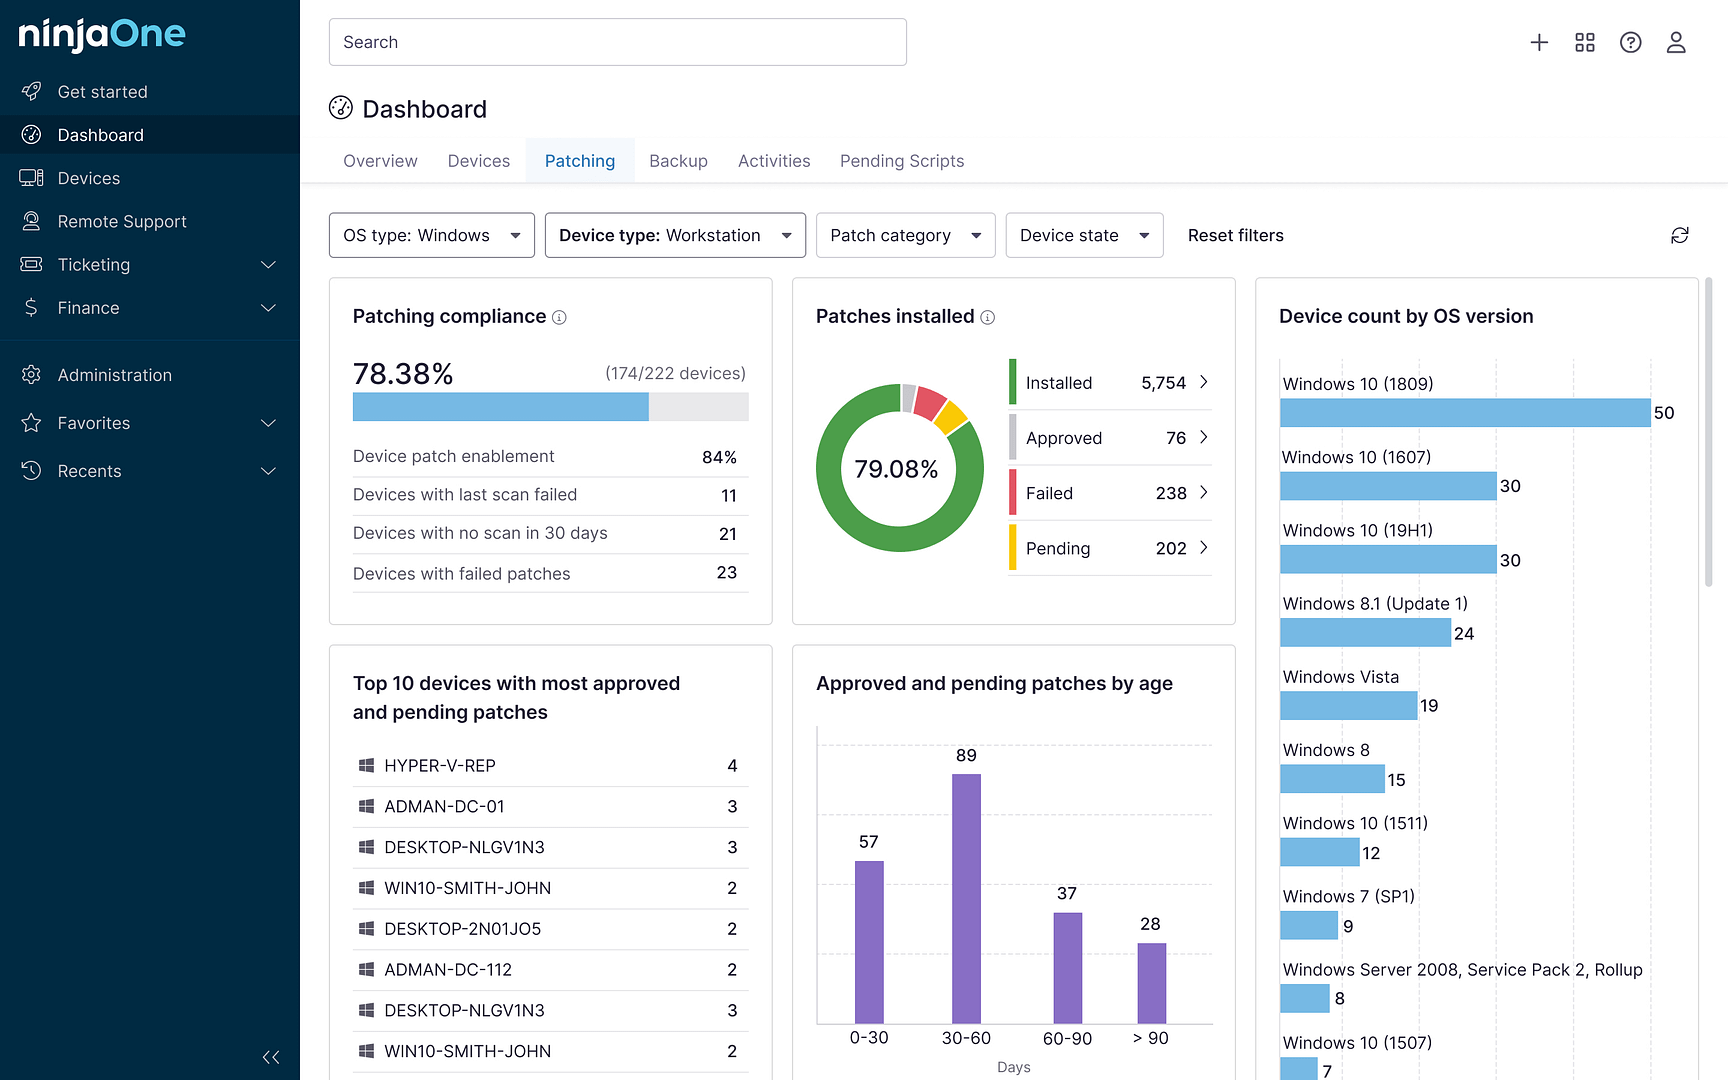
- A single-pane view showing KPIs, project status, business impact metrics.
- ROI calculators for cost savings and revenue impact.
- Timeline infographics showing project milestones.
- Risk heat maps for security, compliance and operational threats.
- Before/after comparisons for efficiency gains.
Connect IT initiatives to strategic goals
To make technology investments resonate with leadership, map every project directly to a business objective. Infrastructure modernization, for example, ties to efficiency gains, while security improvements strengthen customer trust and keep compliance obligations on track. Framing initiatives this way makes the connection between IT and strategy clear.
Here are strategic goals and the initiatives they align with:
- Revenue growth supported by customer-facing system performance improvements and digital capability enhancements.
- Operational efficiency achieved through automation implementations and infrastructure optimization projects.
- Risk mitigation accomplished through security system upgrades and business continuity planning initiatives.
- SaaS Optimization & Waste Reduction achieved by identifying and consolidating unauthorized software deployments (“Shadow IT”) to eliminate duplicate licensing costs and secure corporate data.
- Competitive advantage created through technology innovation projects and digital transformation investments.
Highlight cost savings and risk mitigation
Cost savings and risk mitigation represent tangible business benefits that executives can evaluate using standard financial analysis frameworks. Preventive maintenance programs demonstrate cost avoidance through reduced emergency repairs and system downtime, while security investments quantify protection against potential financial losses from data breaches and operational disruptions. Highlight specific dollar amounts for IT contributions to organizational financial performance and competitive positioning.
Deliver reports that drive IT investment decisions
Structure technology proposals as executive briefings with clear go/no-go recommendations backed by financial analysis. Present three scenarios (minimal, recommended, premium) with corresponding investment levels, timelines and business outcomes. Include competitive benchmarking data and regulatory compliance requirements that position IT spending as a strategic necessity.
Schedule regular executive briefings
Use regular executive briefings to establish consistent communication channels that keep technology initiatives aligned with business priorities and strategic objectives. Create scheduled reports that provide predictable touchpoints for discussing IT performance, upcoming projects and resource requirements using business language and decision-making frameworks. The briefing schedule should align with executive planning cycles and budget processes, positioning IT discussions as integral components of business strategy rather than separate technical conversations.
Adapt reporting based on stakeholder feedback
Adapting reports based on stakeholder feedback improves communication effectiveness and strengthens executive relationships through responsive presentation adjustments. Feedback incorporation demonstrates understanding of executive priorities and willingness to modify communication approaches to better serve business decision-making needs. This involves regularly soliciting input on report content, format and delivery methods while maintaining focus on business outcomes and strategic value rather than technical implementation details.
Get real-time insights on all connected systems and managed devices.
Turn your IT reports into a growth engine
NinjaOne’s IT reporting tool turns raw data into clear insights. Identify underutilized assets, optimize hardware and plan upgrades that keep your infrastructure ready to scale.