

Maintaining patch compliance is integral to system stability and a reduced attack surface. However, certain aspects that represent your infrastructure’s health can be confusing for non-IT counterparts, making comprehensive data visualization key.
Learn the metrics that most impact patch compliance, how to optimize the process, and how to visualize your data using the best tools available.
Monitor patch compliance with advanced methods
Here’s how to harness built-in Windows tools for aggregate data on all your endpoint devices.
📌 Prerequisites:
- Windows 10 (v1903 and beyond) or Windows 11 (v21H2 or later)
- Administrator privileges
- Access to a centralized RMM platform (e.g., NinjaOne)
- Endpoint access for PowerShell, registry queries, and log extraction
- Reporting permissions from Windows Update for Business, WSUS, or Intune
- Microsoft Defender for endpoint health monitoring
- Power BI or Excel for visualization (optional)
📌 Recommended deployment strategies:
Click to Skip to a Step | 💻 Best for Individual Users | 💻💻💻 Best for Enterprises |
| Step 1: Define key metrics for patch and health visibility | ✓ | ✓ |
| Step 2: Collect patch data with PowerShell | ✓ | |
| Step 3: Use the registry to verify compliance status | ✓ | |
| Step 4: Use CMD to validate update services and system health | ✓ | ✓ |
| Step 5: Enforce patch policies via Group Policy | ✓ | |
| Step 6: Visualize data in reports and dashboards | ✓ | ✓ |
Step 1: Define key metrics for patch and health visibility
Here’s a comprehensive list of compliance-related metrics and how they measure system health.
💡 Note: Each client values certain benchmarks over others. Before checking your metrics, ensure your report only covers relevant details.
📌 Use Cases: Outlining data-driven reports, comparing trends, and creating graphics.
Patch compliance KPIs
- % of systems fully patched: Reflects the number of patched systems in relation to your entire infrastructure.
- Number of missing critical or security updates: Highlights the gaps in your patch deployments.
- Devices with failed patch installs: Workstations that experienced patch errors.
- Days since last successful update: Helps identify underserved systems.
- Mean time to remediate (or MTTR): The average patch application response time.
- Offer deeper time-based insights with time-to-detect (MTTD), time-to-prioritize (MTTP), and time-to-communicate (MTTC).
System health KPIs
Verify your system is performing at its best with these metrics:
- AV and firewall status: Block malware and browse the internet on the endpoint device safely.
- Disk health, CPU/memory thresholds: Track response times, queue issues, and component health.
- Last reboot time: A crucial metric that determines when a patch fully applies to a workstation.
- Service availability (e.g., Defender, Windows Update): Readiness of critical services like Windows Update or SQL Server Services.
🥷| Utilize vital system metrics to create comprehensive patch compliance reports.
Step 2: Collect patch data with PowerShell
Deploy powerful scripts for constant monitoring.
📌 Use Cases: Get deep insights on client compliance to create and export readable logs.
- Press Win + R, type powershell, and press Ctrl + Shift + Enter.
- To list recently installed patches, run the following:
Get-HotFix | Sort-Object InstalledOn -Descending | Select-Object -First 5
- To generate and save a readable Windows Update .txt log file in your desktop, run the following:
Get-WindowsUpdateLog
- To list an endpoint’s pending, failed, and successful updates over time, run the following:
Get-WUHistory
⚠️ Important: The Get-WUHistory cmdlet above is not built into PowerShell. To access it, install the PSWindowsUpdate module by running Install-Module -Name PSWindowsUpdate.
- To save hotfix data to CSV for reporting, run the following:
Get-HotFix | Select-Object Description, HotFixID, InstalledBy,
InstalledOn | Export-Csv “<FilePath>” -NoTypeInformation
Replace <FilePath> with the complete file path of where you want the .csv file to be stored (e.g, C:\User\Reports\Desktop).
💡 Note: This exports only hotfixes, not all update types.
🥷 | Running scripts with remote management platforms simplifies the process for clients and offers scalability.
Step 3: Use Registry Editor to verify compliance status
⚠️ Warning: Editing the registry can cause system issues. Create a backup before proceeding.
📌 Use Cases: Confirm patch compliance with the presence of certain registry keys.
- Press Win + R, type regedit, and press Ctrl + Shift + Enter.
- Navigate to:
HKEY_LOCAL_MACHINE\SOFTWARE\Microsoft\Windows\CurrentVersion\WindowsUpdate\Auto Update\Results\Install
- The LastSuccessTime key stores timestamps of the last successful update and indicates that your endpoint has been receiving recent hotfixes.
💡 Note: The LastSuccessTime key’s absence doesn’t necessarily mean your system is non-compliant. It may be missing due to third-party patching tools (ie. not WSUS), a lack of recent updates, or registry clean-ups.
Alternatively, you can check for systems that haven’t received updates by:
- Checking install history logs in Windows Event Viewer.
- Comparing OS versions against the latest vendor release.
- Use RMM dashboards like NinjaOne to filter devices with low compliance.
- Identify systems that haven’t checked in recently via the LastCheckIn timestamp.
- Alternatively, navigate to:
HKEY_LOCAL_MACHINE\SOFTWARE\Microsoft\Windows\CurrentVersion\WindowsUpdate\Auto Update
- The RebootRequired key is a flag for a pending patch. This typically confirms that an update is pending, but not all updates require a reboot. Here are other ways to check if your system requires a reboot for a pending update:
- Via Windows Update GUI: Settings > Update & Security > Windows Update
- Via PowerShell:
Get-WindowsUpdateLog
Get-WUHistory | Where-Object {$_.ResultCode -eq 2}
- Via Registry Editor:
HKEY_LOCAL_MACHINE\SYSTEM\CurrentControlSet\Control\Session Manager (a reboot is needed if the PendingFileRenameOperations key is present).
💡 Note: If the Auto Update key is missing, it may indicate that:
- Your system uses third-party patching tools instead of WSUS.
- Windows Update is disabled.
- There have been no recent updates.
- Registry clean-up may have removed the key.
Alternatively, you can check update status via:
- Windows Update GUI: Settings > Windows Update.
- PowerShell: Get-HotFix or Get-WindowsUpdateLog.
- Event Viewer: Applications and Services Log > Microsoft > Windows > WindowsUpdateClient.

- Navigate to:
HKEY_LOCAL_MACHINE\SOFTWARE\Microsoft\Windows\CurrentVersion\WindowsUpdate
The SusClientIdValidation key is part of the WSUS client configuration. It confirms whether your device is being properly validated during synchronization.
💡 Note: If your organization doesn’t use WSUS (e.g., it’s being managed by NinjaOne RMM, or third-party tools), the SusClientIdValidation key won’t be present.
As an alternative, validate endpoint patch compliance through:
- PowerShell: Run Get-HotFix to list recent hotfix updates.
- Windows Update: Go to Settings > Windows Update > Update History.
- Event Viewer: Navigate to Applications and Services Logs > Microsoft > Windows > WindowsUpdateClient.
Step 4: Use CMD to validate update services and system health
📌 Use Cases: Scripts that automate device health checks; forensic data reports.
- Press Win + R, type cmd, and press Ctrl + Shift + Enter.
- To check if the Windows Update service is running properly, run the following:
sc query wuauserv
This helps troubleshoot update engine errors.
- To pull up the system’s last known boot time, run the following:
systeminfo | find “System Boot Time”
This helps track when a patch was last fully implemented.
⚠️ Important: Disable Fast Startup for more accurate results.
- To list failed Windows Update installation failures, run the following:
wevtutil qe System “/q:*[System[(EventID=20)]]” /c:5 /f:text
Past event logs with Event ID 20 can pinpoint patch failures.
💡 Tip: Modify “c:5” to show more or fewer log entries.
Step 5: Enforce patch policies via Group Policy
📌 Use Cases: Reduce downtime on required update services (e.g., Windows Update, Event Log).
📌 Prerequisites: Windows 10/11 Pro, Education, or Enterprise.
- Press Win + R, type gpedit.msc, and press Ctrl + Shift + Enter.
- Navigate to:
Computer Configuration > Administrative Templates > Windows Components > Windows Update
- Double-click Configure Automatic Updates.
- Set it to Enabled.
- Choose your preferred configuration (e.g., Auto download and schedule the install).
- This grants admins granular control over how updates are applied to your system.
- Double-click Specify Intranet Microsoft Update Service Location (for WSUS).
- Set it to Enabled.
- Enter your WSUS server’s URL (e.g., https://www.wsusworkserver:1234).
- This redirects the client from Microsoft Update to a WSUS server with your configurations and statistics data.
- Double-click No Auto-Restart with Logged-On Users for Scheduled Automatic Updates Installations.
- Set it to Enabled.
- This feature prevents automatic restarts when a user is logged in. It only works when “Configure Automatic Updates” is enabled.
- Set it to Enabled.
- Navigate to:
Computer Configuration > Windows Settings > Security Settings > System Services
💡 Note: The System Services key only exists in the GPMC on domain-joined systems. It won’t be visible in standalone machines and Windows Home edition PCs.
Instead, manually open services.msc > Right-click on the update service (e.g., Windows Update) > Select Properties > Modify startup behavior to “Automatic” for consistent install times > Click Apply, then OK.
- Enable the following system services to modify startup behavior on essential updates.
- Windows Update (wuauserv)
- Background Intelligent Transfer Service (BITS)
- Windows Event Log
- Windows Installer
- Cryptographic Services
- Windows Management Instrumentation (WMI)
For additional details, read Microsoft’s official documentation on configuring update settings via Group Policy.
Step 6: Visualize data in reports and dashboards
Here are the most widely used services for data visualization and how they help present policy compliance:
NinjaOne
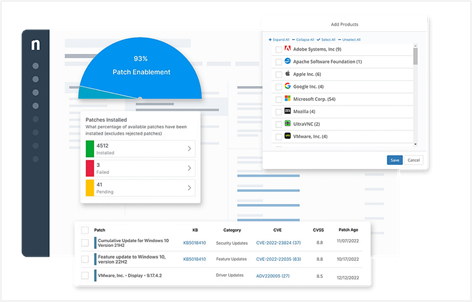
NinjaOne’s streamlined dashboard displays graphed out data based on real-time data (by tenant, operating system, or device group), offering at-a-glance convenience for MSPs and IT personnel.
With visualized sections for patch management across mixed environments (Pending, Approved, Rejected, etc.), NinjaOne’s interface streamlines your policy compliance report for you.
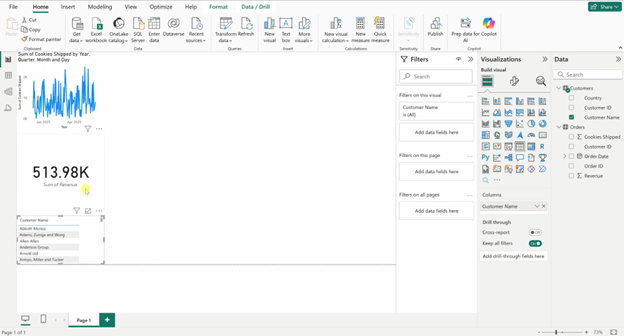
Microsoft Power BI
Microsoft’s data visualization platform offers interactive dashboards that encourage modularity, portable CSV reports, and API data from other endpoint management software.
Interactive heat maps, pie charts, customizable slicers, and more can be tailored to your client’s preferences—whether for stakeholder meetings or IT security departments.
Excel
You can analyze and illustrate patch compliance data with two specialized Excel tools: PivotTables and Conditional Formatting.
PivotTables is an Excel functionality that extracts relevant data from large spreadsheets to craft condensed reports you can reformat and graph with Excel’s data visualization features.
Use Conditional Formatting to enhance Excel reports further. These color-coded rules (typically used for visual risk indicators) can visually separate compliant from non-compliant devices, prioritize remediation, and make client-facing reports feel more intuitive.
💡 Tip: Stakeholders, clients, or executives typically expect data to be illustrated via:
- Heat maps
- Pie charts
- Line graphs
- Segmented data (i.e., broken down by website, urgency, operating systems, etc.)
⚠️ Things to look out for
| Risks | Potential Consequences | Reversals |
| Script errors or lack of admin rights | Incomplete or imprecise data | Validate syntax and run programs with the correct privileges. |
| Misconfigured GPOs | Non-compliance across multiple client systems | Review GPOs in the management console, force an update, and check for any AD replication. |
| Misrepresented data and sub-par visuals | Delayed responses, overlooked compliance drift | Automate data refresh; use dashboards with real-time updates. |
Additional considerations for system health monitoring
Keep these insights in mind to optimize your process, avoid pitfalls, and understand potential roadblocks.
Reboot policies
Updates require a reboot to complete their installation process. Enforcing reboot policies on endpoints with tools like NinjaOne, Autopatch, or Intune can make this seamless.
Out-of-band updates
New evolving cybersecurity threats can prompt unscheduled patches to protect your system’s security and functionality. To expedite this, consider applying exceptions that let urgent updates bypass deferral policies.
Third-party patching
Non-Microsoft software also requires constant monitoring to maintain a robust security posture. Many vulnerabilities originate from third-party apps, so use RMM platforms like NinjaOne for effective post-patch surveillance.
Offline devices
Disconnected client devices can miss updates, compromising endpoint security and skewing policy compliance reports. To account for these workstations, you may use offline patching tools like WSUS.
Troubleshooting common patch compliance errors
Here’s how to diagnose and resolve update failures that MSPs and IT personnel encounter.
Patch failures
If your update fails to install or apply correctly, run event log audits and endpoint monitoring software (e.g., NinjaOne, Intune) to remediate.
Missing data
Disabling telemetry services can create gaps in your management dashboard’s data. To resolve this, re-enable diagnostic data collection in Intune.
Registry keys missing
The lack of certain registry items (especially those that represent update progress) can prevent device enrollments and even produce false readings. To manage this, verify your registry’s integrity and update history.
Visualization errors
Sync issues and data formatting rules can hamper data visualization. Prevent poor oversight and unmitigated gaps with Performance Diagnostics and other monitoring software.
NinjaOne services
🥷🏽 NinjaOne’s best-in-class RMM capabilities provide system health reports by:
- Extracting registry and event log data via in-house PowerShell scripts
- Summarizing per-client, per-region, or multi-tenant compliance status for quick reporting
- Tracking patch install progress across your infrastructure
- Notifying IT staff about incomplete/failed updates, reboot prompts, and device status
- Flagging devices for compliance drift in real-time
Observe patch compliance with comprehensive reports
Patch compliance can be monitored and audited using advanced tools or through remote management platforms with built-in report generation. Either way, you should always establish backups for important system settings to uphold data integrity policies and support future compilations.
Related topics:
- What Is Patch Compliance?
- 10 Essential Metrics for Patch Management Success
- Patch vs Update: Understanding the Key Differences
- Viewing Healthy System
- How to Run a PC Diagnostics Report in Windows
Quick-Start Guide
NinjaOne does indeed provide comprehensive visualization of Patch Compliance and System Health across all clients. Here are the key details:
Patch Compliance and System Health Visualization
Patch Management Dashboard Features:
- Provides a holistic view of patching status across all devices
- Displays patch compliance with multiple widgets, including:
- Patching Compliance: Shows patch-enabled devices that are fully patched
- Patches Installed: Percentage of available patches installed
- Detailed breakdown of patch statuses (Installed, Approved, Failed, Pending)
- Device count by OS version
System Health Dashboard Highlights:
- Comprehensive device health overview across all organizations
- Breaks down health issues into categories such as:
- Servers currently down
- Devices with active/blocked and quarantined threats
- Devices with failed and pending OS/software patches
- Devices with triggered conditions
- Pending reboots
- Devices with maintenance mode windows
Additional Visualization Tools:
- Clickable widgets that drill down into specific device details
- Ability to filter by OS type, device type, and patch category
- Export capabilities to CSV for further analysis
- AI-powered Patch Intelligence feature that provides sentiment analysis on patches
The dashboards are available at system, organization, and device levels, allowing for granular or comprehensive views of patch compliance and system health.


