


Key Points
- Patch management metrics are quantifiable measures that assess the effectiveness of patching programs.
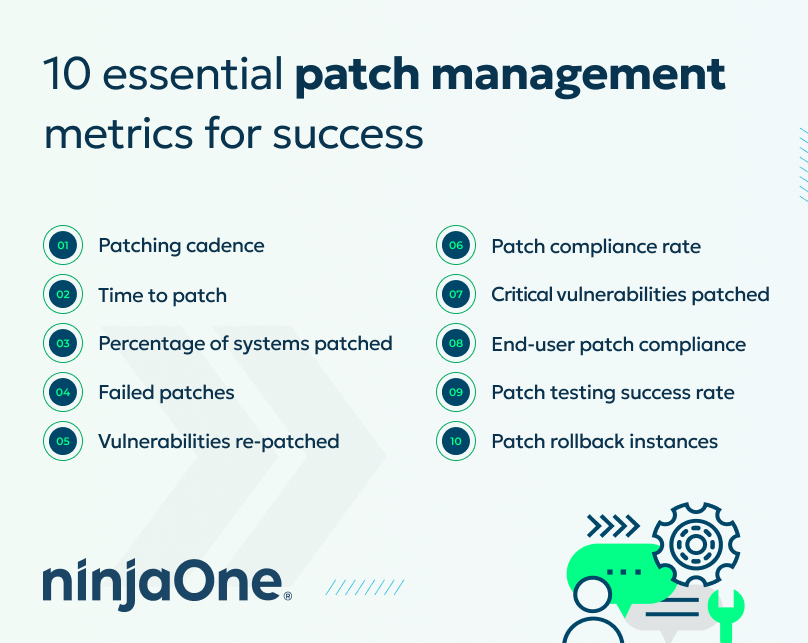
- The essential metrics include patching cadence, time to patch, percentage of systems patched, failed patches, and vulnerabilities re-patched. They also include compliance rate, critical vulnerabilities patched, end-user patch compliance, patch testing success rate, and patch rollback instances..
- Time to patch, patch compliance rate, critical vulnerabilities patched, and failed patches provide a quick view of patching effectiveness. Together, they highlight security exposure and deployment reliability issues.
- Tracking these metrics over time helps teams identify bottlenecks and weaknesses in patch testing and deployment. The results also support audit evidence and help prioritize process improvements.
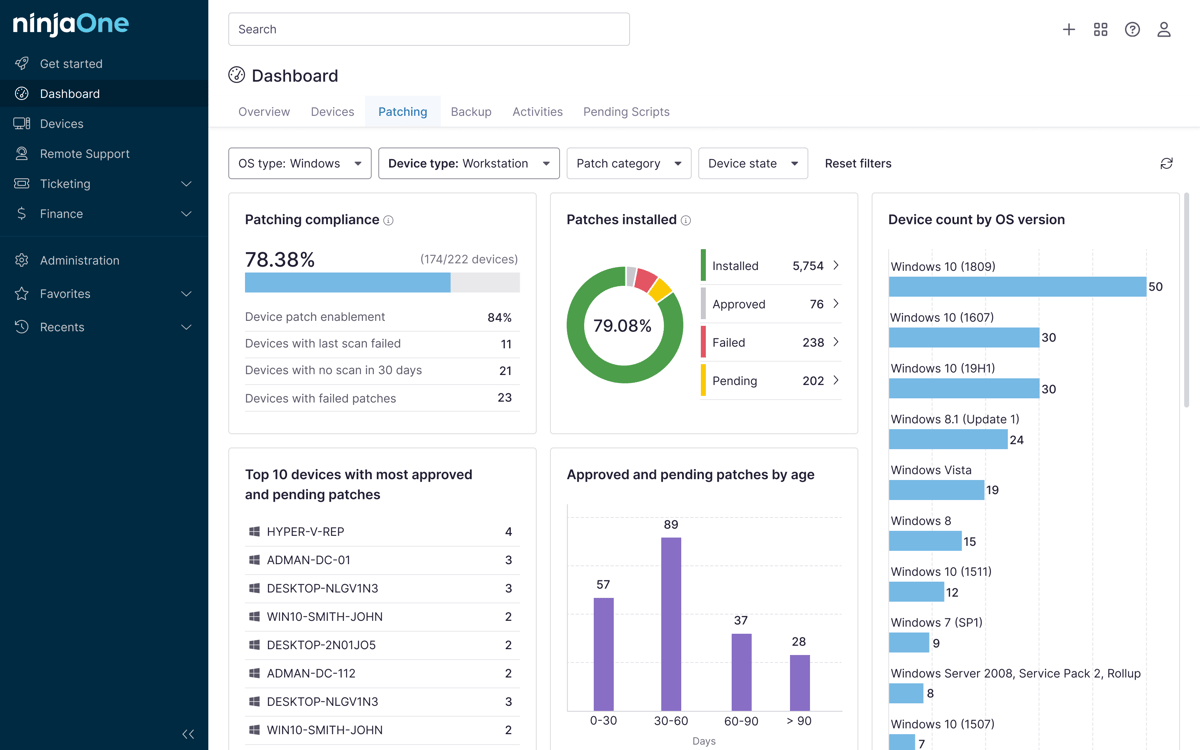
- NinjaOne Autonomous Patch Management tracks patch status and compliance across Windows, macOS, and Linux endpoints. IT teams can generate patch reports from one console to monitor progress and identify systems that need immediate attention.
Patch management metrics are the key measurements IT teams use to track, evaluate, and improve their patching process. These metrics and KPIs provide a clear, quantifiable way to assess patching effectiveness, measure response times, and ensure compliance with security standards.
In this article, we’ll cover 10 essential patch management metrics for success, explain why they matter, and show how IT teams can use them to improve efficiency and security outcomes.
Learn more about NinjaOne Patch Management Reports that provide detailed insights for secure, efficient patching and proactive vulnerability oversight.
Key patch management metrics to watch
While there are 10 essential metrics every IT team should track, these stand out as the most impactful:
- Time to patch: Measures how quickly vulnerabilities are remediated after discovery. A shorter time frame means reduced exposure to cyber threats.
- Patch compliance rate: Tracks adherence to internal policies and regulatory standards, a must for passing audits and maintaining trust.
- Critical vulnerabilities patched: Focuses on the percentage of high-severity flaws fixed on time, which has the biggest impact on risk reduction.
- Failed patches: Reveals reliability issues in the patching process and highlights where additional testing or process improvements are needed.
These metrics provide a quick snapshot of patching performance. Below, we’ll walk through all 10 metrics in detail and explain how each one contributes to patch management success.
The video 10 Essential Metrics for Patch Management Success puts the full framework in context.
10 essential patch management metrics for success
#1. Patching cadence
- Definition and significance: Patching cadence refers to the frequency and regularity with which patches are applied within an organization. It is a critical metric for ensuring that systems remain secure and up to date. A well-defined patching cadence helps organizations keep pace with the release of new patches, minimizing the window of vulnerability.
- Importance of regularity: The strategic implementation of a regular patching cadence significantly reduces exposure to vulnerabilities. By systematically updating systems, organizations can mitigate the risks associated with outdated software and protect against potential breaches.
NinjaOne® advantage: NinjaOne automates recurring patch cycles, keeping cadence consistent across all devices without manual oversight.
#2. Time to patch
- Metric measurement: The Time to Patch metric quantifies the interval between the discovery of a vulnerability and the successful deployment of its patch. This metric is pivotal in gauging the responsiveness and agility of an organization’s patch management process.
- Significance in vulnerability management: A swift Time to Patch is indicative of an efficient vulnerability management program. It reflects an organization’s capability to quickly mitigate risks, a key factor in maintaining robust security defenses.
NinjaOne advantage: NinjaOne enables rapid deployment of critical patches across endpoints, shrinking patch lag and reducing risk exposure.
#3. Percentage of systems patched
- Measures: Proportion of systems that have been updated with the latest patches. It provides a comprehensive view of the patch coverage across an organization’s IT infrastructure.
- Relevance to vulnerability management: The percentage of systems patched is crucial for assessing the thoroughness and effectiveness of patch management efforts. High coverage ensures that vulnerabilities are uniformly addressed, reducing the overall risk profile.
NinjaOne advantage: NinjaOne shows patch coverage across the fleet in one view, so gaps can easily be identified.
#4. Failed patches
- Tracking failures: Monitoring failed patch applications is essential for identifying and rectifying issues within the patch management process. This metric sheds light on the reliability of patch deployments.
- Mitigation strategies: Address the underlying causes of failed patches to maintain system security. By analyzing failures, organizations can refine their patching processes, ensuring higher success rates in future deployments.
NinjaOne advantage:NinjaOne reports patch installation status by device, so IT teams can find and remediate failures quickly.
#5. Vulnerabilities re-patched
- Occurrence and implications: Tracking instances where vulnerabilities need to be re-patched is important for understanding the effectiveness of the initial patching effort. This metric indicates the resilience of patches and the need for continuous monitoring.
- Strategic importance: The need to re-patch vulnerabilities underscores the importance of a dynamic and adaptable patch management strategy. It highlights areas for improvement in patch testing and deployment practices.
NinjaOne advantage: NinjaOne logs historical patch activity, making it easier to identify recurring issues and strengthen patch quality.
#6. Patch compliance rate
- Ensuring adherence: The Patch Compliance Rate metric measures compliance with organizational and regulatory standards for patching. It is a key indicator of how well an organization maintains its security posture in accordance with established guidelines.
- Role in security: High compliance rates are indicative of a secure and well-managed IT environment. Ensuring patches meet compliance standards is crucial for mitigating risks and adhering to best practices.
NinjaOne advantage:NinjaOne automatically generates patch reports on update availability and patch status, which IT leaders can use as audit evidence
#7. Critical vulnerabilities patched
- Prioritization of efforts: Focusing on the patching of critical vulnerabilities is essential for effective risk management. This metric highlights the organization’s ability to identify and address the most severe threats promptly.
- Influence on strategy: Prioritizing critical vulnerabilities informs the strategic direction of vulnerability management efforts. It ensures that resources are allocated efficiently, maximizing the impact of the patch management program.
NinjaOne advantage:NinjaOne maps CVEs to affected endpoints using imported vulnerability scanner data, and administrators can set CVSS-based rules that automatically approve and deploy critical patches.
#8. End-user patch compliance
- Monitoring compliance: Assessing patching compliance of end-user devices ensures comprehensive security coverage. This metric reflects the success of policies and practices aimed at keeping user systems up to date.
- Importance of education: Educating end-users on the importance of regular patching is vital for maintaining security. Awareness initiatives can significantly enhance compliance rates, contributing to the overall resilience of the IT infrastructure.
NinjaOne advantage: NinjaOne delivers centralized visibility into endpoint patching across distributed workforces.
#9. Patch testing success rate
- Evaluating effectiveness: The success rate of patch testing in a controlled environment is indicative of the reliability and compatibility of patches. This metric is crucial for ensuring that patches do not adversely affect system operations.
- Ensuring quality: A high patch testing success rate minimizes the risk of disruptions, affirming the quality and efficacy of the patch management process. It underscores the importance of thorough testing before widespread deployment.
NinjaOne advantage: NinjaOne enables pilot testing of patches in smaller groups to validate functionality before full deployment.
#10. Patch rollback Instances
- Frequency and causes: Measuring the instances of patch rollbacks provides insight into the stability and performance of deployed patches. This metric is essential for identifying patches that may cause issues within the IT environment.
- Continuous assessment: Tracking patch rollbacks is crucial to ongoing evaluation and improvement of the patch management strategy. It enables organizations to quickly address and rectify issues, ensuring the continuous health of IT systems.
NinjaOne advantage:NinjaOne can uninstall specific Windows patches that cause compatibility issues, and patch activity views help IT teams trace which updates require rollback.
Below is a quick summary of the ten patch management metrics you should track:
| Metric | What it measures | Why it matters |
| Patching cadence | The frequency and regularity of patch deployment across the organization | Having a consistent patching cadence minimizes the window of vulnerability between releases |
| Time to patch | The interval between vulnerability discovery and patch deployment | Shows how quickly an organization can close a known security gap |
| Percentage of systems patched | The proportion of systems updated with the latest patches | Reveals how complete patch coverage is across the environment |
| Failed patches | The number of patch deployments that did not complete successfully | Flags reliability issues in the patching process before they compound |
| Vulnerabilities re-patched | How often a vulnerability requires a second patching attempt | Demonstrates whether the initial patch and the testing behind it actually held |
| Patch compliance rate | Adherence to internal policy and regulatory patching standards | Supports audit readiness and demonstrates a managed security posture |
| Critical vulnerabilities patched | The share of high-severity vulnerabilities patched on time | Directly reduces exposure to the threats that are most likely to cause harm |
| End-user patch compliance | Patch status across end-user devices specifically | Confirms security coverage extends beyond servers to the entire device fleet |
| Patch testing success rate | How often patches pass testing in a controlled environment before deployment | Reduces the risk of a patch disrupting operations |
| Patch rollback instances | How often a deployed patch has to be reversed | Highlights patch stability issues and where the deployment process needs adjustment |
Tracking these metrics helps strengthen security and reduce risks. For more insights, watch our video, Patch Management Mistakes and How to Avoid Them.
Why patch management metrics matter
Establishing specific metrics and IT Key Performance Indicators (KPIs) is essential for the success of any patch management strategy. Metrics provide a quantifiable measure of performance, allowing organizations to assess the effectiveness of their patching processes. KPIs, in turn, offer insights into how well these processes align with broader security objectives.
Together, these tools form the foundation for effective patch management strategies, enabling continuous improvement and adaptation to the evolving cybersecurity landscape.
5 key benefits of tracking patch management metrics
Enhanced visibility into patching progress and security posture
Tracking patch management metrics provides full visibility into how many systems are patched, where vulnerabilities remain, and how quickly teams respond. This visibility helps IT leaders understand the true state of their defenses and make smarter, more informed decisions.
Faster identification of bottlenecks or inefficiencies
Metrics highlight where patching efforts slow down, whether it’s in testing, approval, or deployment. For example, a long time-to-patch metric may reveal process bottlenecks that put the organization at risk. By identifying inefficiencies early, IT teams can adjust workflows, assign resources more effectively, and reduce delays that attackers could exploit.
Improved compliance alignment with industry regulations
Regulatory frameworks like HIPAA, PCI-DSS, and GDPR often require timely patching and reporting. Tracking compliance-focused metrics ensures organizations can prove adherence during audits. Instead of scrambling to show patch records, IT teams can rely on documented patch compliance rate metrics that demonstrate alignment with industry standards and avoid costly fines.
Stronger prioritization of critical vulnerabilities
Tracking the percentage of critical vulnerabilities patched gives IT leaders assurance that high-severity issues are resolved first. This prioritization reduces overall exposure and ensures security resources are allocated where they deliver the greatest impact.
Continuous improvement through data-driven insights
Over time, patching metrics create a valuable feedback loop. Trends in failed patches, rollback instances, or re-patched vulnerabilities highlight areas where processes need refinement. By using this data, IT teams can continuously improve testing, deployment, and compliance strategies.
What patch compliance metrics should IT operations report to executives?
Executives need six metrics to understand patch compliance, security exposure, and remediation progress. This includes:
Enhanced visibility into patching progress and security posture
Track the percentage of managed endpoints that meet your patch policy. For example, if 38,400 of your 40,000 endpoints are compliant, then the compliance rate is 96%, with 1,600 devices needing immediate attention.
Critical patch compliance within SLA
Highlight the percentage of applicable endpoints that received critical patches within your SLA, such as 14 days. If 23,750 of 25,000 devices were patched on time, compliance is at 95%. The remaining 1,250 endpoints that missed the deadline, and any other devices still unpatched, will require a target remediation deadline.
Mean time to patch critical updates
Measure the average number of days between identifying a critical vulnerability and deploying its patch. A decrease from 18 days to 9 days indicates that IT is effectively reducing the time devices are left exposed.
Overdue critical exposure
Track the percentage of managed endpoints that meet your patch policy. For example, if 38,400 of your 40,000 endpoints are compliant, then the compliance rate is 96%, with 1,600 devices needing immediate attention.
Failed patch rate
Track the percentage of patch installation attempts that failed, along with the number of affected endpoints. A 2% failure rate across 30,000 attempts means there are 600 failed installations. Report the affected device count separately, since one endpoint can have multiple failed installations.
Approved exceptions
Some endpoints, like legacy systems, may have approved exemptions from specific patching requirements. If 700 out of 35,000 endpoints have exceptions, that’s 2% of the entire fleet. Make sure each exception has an owner and an expiration date to prevent it from becoming a permanent blind spot.
Keep the report to one page and highlight trends across the last three to six reporting periods. This way, executives can quickly see what’s improving and where remediation is needed.
Incorporating metrics into a patch management strategy
The ongoing monitoring, evaluation, and refinement of patch management metrics are paramount for maintaining an effective patching strategy. Utilizing these metrics as a feedback loop, organizations can dynamically adjust their security measures in real time.
By continually assessing these metrics, organizations can identify areas for improvement, adapt their processes to meet evolving challenges, and ensure their patch management efforts align with best practices and security requirements.
Integrating patch management metrics with broader vulnerability management KPIs creates a comprehensive overview of an organization’s security posture. This integration facilitates a unified security vision that is greater than the sum of its parts, enhancing organizational agility in threat detection and response.
This holistic approach enables a more coordinated and effective response to cybersecurity threats, ensuring that patch management efforts contribute significantly to the organization’s overall security strategy.
Learn more about NinjaOne Patch Management Reports that provide detailed insights for secure, efficient patching and proactive vulnerability oversight.
Strengthening IT security with patch management metrics
Patch management metrics give IT teams the hard data they need to measure effectiveness, spot gaps, and prove the value of their patching strategy. By tracking the right KPIs, organizations can prioritize critical vulnerabilities, improve compliance, and reduce risks before they turn into costly incidents.
Take control of your patch management and enhance IT security with NinjaOne Autonomous Patch Management. Our solution provides quantifiable insights into the effectiveness of your patch management processes, enabling you to make informed decisions, prioritize actions, and adapt strategies to mitigate risks effectively.