🔑 Key Points
- Proactive IT Capacity Planning with RMM
RMM platforms help IT teams and MSPs proactively forecast infrastructure needs, optimize performance, and prevent bottlenecks by limited CPU, RAM, or storage. - Automated Hardware & Performance Monitoring
PowerShell, Bash, and CMD scripts automate device inventory, monitor CPU/memory/disk usage, and detect aging or underperforming hardware. - Cross-Platform Compliance & Lifecycle Management
RMM solutions centralize device data, enforce encryption and security policies, align with warranty and support cycles, and ensure OS readiness (e.g., Windows 11 compatibility). - Trend Analysis & Forecasting for IT Growth
Monitoring key thresholds (disk, RAM, CPU) enables early bottleneck detection, smarter refresh cycles, and data-backed IT budget planning. - NinjaOne for Data-Driven Optimization
NinjaOne streamlines capacity planning with automated inventory, scripting, reporting, and lifecycle tagging to boost efficiency and reduce costs.
Capacity planning is a key role for IT teams and managed service providers (MSPs), allowing you to plan ahead and ensure your IT infrastructure can handle and enable future growth.
This guide provides examples of how remote monitoring and management (RMM) platforms, combined with scripting and automation, can be used to assess your devices’ performance and utilization to ensure they are meeting your end-users’ needs. By leveraging PowerShell in Windows and Bash scripting in macOS/Linux, you can preemptively identify devices that are no longer meeting their end users’ requirements, and align your hardware refresh lifecycles with real-world trends.
Why IT Teams and MSPs need informed hardware capacity planning
Productivity is negatively affected if users’ devices cannot keep up with their day-to-day tasks. Insufficient drive space can slow down devices and prevent them from functioning correctly, a lack of CPU power or memory can make apps run slowly (especially modern web-based productivity software), and obsolete hardware may not support modern encryption and security standards. This can negatively impact a business’s efficiency, and even lead to compliance issues.
Centrally monitoring for under- or over-utilized devices means that these problems can be proactively identified. Devices can then be upgraded, replaced, or re-assigned on a lifecycle that ensures that all IT resources are fully optimized, without unnecessary cost. This is particularly important with the end of support for Windows 10: many devices do not support running Windows 11, even when upgraded, and will need to be rapidly replaced.
Key goals and prerequisites
RMM platforms provide a central place for collecting, parsing, reporting, and alerting on devices’ hardware, software, and user activity. As part of their remote management features, many RMM solutions also support the remote execution of scripts.
This allows you to deploy custom scripts that collect the metrics relevant to your organization, and ensure that all devices meet your requirements. This can include:
- Inventory age and specification data
- CPU, memory, disk I/O, and thermal performance
- Underperforming or over-utilized devices
- Hardware health metrics
To do this, you will require:
- A RMM platform with inventory collection, automation, and reporting (for example, NinjaOne)
- Script support (PowerShell for Windows, Bash for Linux/macOS)
- Access to system BIOS or WMI for hardware manufacturing data
- Optional access to Group Policy in Windows domain environments to enforce consistent logging and data availability
- Knowledge of your organization’s hardware lifecycle policies or warranty periods
In addition to this, you can also use RMM to monitor for compliance factors, such as whether encryption is enabled, and enforce policies.
Using PowerShell to collect hardware age and specifications
While it’s increasingly common for devices to last many years and still be able to keep up with their defined tasks, age can be a good way to identify when hardware may be a candidate for replacement. For example, you may want devices to always be within warranty, or to identify devices that will no longer be supported by the latest operating system updates. You may also want to identify whether you have specific device models in your fleets to address known flaws or product recalls.
On Windows devices with PowerShell available, you can get the hardware manufacturer and model by running the command:
Get-CimInstance Win32_ComputerSystem | Select-Object Manufacturer, Model
You can also retrieve the BIOS release date, which can be used to assess a device’s age:
Get-CimInstance Win32_BIOS | Select-Object ReleaseDate
Run the following command on each device to catalogue CPU info:
Get-CimInstance Win32_Processor | Select-Object Name, MaxClockSpeed, NumberOfCores
Or query RAM and disk capacity:
Get-CimInstance Win32_PhysicalMemory | Measure-Object -Property Capacity -Sum
Get-PSDrive -PSProvider ‘FileSystem’ | Select Name, Free, Used
Once data has been collected, you can export the output of the above commands by running:
Export-Csv -Path “C:\Reports\hardware_summary.csv” -NoTypeInformation
This data can then be held for future analysis, or sent to your RMM platform for reporting.
CMD-Based inventory and performance checks
Legacy devices that do not support PowerShell can be inspected using CMD commands from the command prompt.
Get the system model and manufacturer name:
wmic computersystem get manufacturer, model
Read BIOS date and version:
wmic bios get releaseDate, version
Check system uptime:
net statistics workstation | findstr “since”
Read disk usage:
wmic logicaldisk get caption, size, freespace
Using Bash on Linux/macOS for asset inventory
You can also catalogue your Linux and macOS devices for capacity planning using Bash commands and scripting.
CPU info on Linux can be collected by running:
lscpu | grep “Model name”
Check the amount of RAM on Linux with the command:
free -h
Output disk and partition usage on Linux and macOS:
df -h
Read BIOS or hardware date in Linux:
dmidecode -t bios | grep -i date
On macOS, you can use the system_profiler command for detailed hardware information.
If your RMM is cross-platform and supports Windows, macOS, and Linux, you can collect all capacity planning data in one location for a full overview of your devices’ health and usage.
Using the Registry to detect aging hardware characteristics
The Windows Registry also includes information that is useful for assessing devices for capacity planning purposes. You can query registry values with PowerShell. For example, the installation date of the OS (a proxy for system deployment date) is stored in InstallDate at HKEY_LOCAL_MACHINE\SOFTWARE\Microsoft\Windows NT\CurrentVersion, while the system model and OEM tag are often stored in the SystemProductName and BaseBoardManufacturer within HKEY_LOCAL_MACHINE\HARDWARE\DESCRIPTION\System\BIOS.
Using Group Policy to enforce baseline logging for capacity monitoring
Group Policy in Active Directory can be used to enforce configurations to standardize what data is logged for later inventory and performance analysis. Using Group Policy Objects (GPOs), you can enforce audit logging of performance events, trigger local scripts to run on startup/shutdown to capture system information, and configure Windows Event Logs to retain performance or storage usage metrics.
Group Policy can also be used to add scheduled scripts for uploading captured information to your RMM solution if it does not do so itself through its agent software.
Trending and threshold-based forecasting
Effective capacity planning requires identifying trends over time to predict future performance issues (such as a device running out of space), and future capacity requirements. For example, you may track systems with <15% disk space for more than 30 days, monitor average RAM usage exceeding 85% over 2 months, or identify systems with CPUs running consistently above 80%.
Tracking these kinds of metrics will help identify devices that are falling behind, before they frustrate users.
Additional considerations for IT capacity planning
You should keep inventory of all of your devices and automate warranty checks using your RMM platform. If a device malfunctions, you can then determine immediately whether the best action is repair or replacement.
Plan your hardware and software lifecycles in coordination: if a known operating system or software requirement is on the horizon, make sure your hardware refresh aligns with it and meets those requirements. This can be aided by differentiating refresh cycles by device role, ensuring costs are optimized and that users aren’t receiving devices that exceed their requirements, and that power users are not limited by their hardware.
By correlating your capacity planning across hardware and software, identifying and meeting user requirements, you can support IT budgeting discussions with evidence and ensure that you can justify the resources required to keep your users working efficiently.
Troubleshooting capacity planning data collection
There are a few common issues IT departments and MSPs run into when collecting hardware data remotely:
- Incomplete hardware data: Ensure WMI service is running or PowerShell is allowed
- Old systems missing CIM classes: Use fallback to Get-WmiObject or wmic
- Inconsistent outputs across OS: Normalize data in CSV with clear headers and units before reporting
- Data collection fails: Verify script permissions and output folder access
Using NinjaOne for fully informed, data-driven capacity planning
NinjaOne enables data-driven capacity planning, powered by its RMM platform and comprehensive enterprise IT administration and MSP toolset.
Using NinjaOne, you can perform cross-platform inventory tracking, including the automated, periodic collection of operating system, manufacturer/model, CPU, memory, storage, BIOS/UEFI, and other hardware and software data across Windows, macOS, and Linux.
You can deploy custom PowerShell, CMD, and Bash scripts to every device, schedule data collection jobs to identify trends, and export all data for custom hardware lifecycle reporting. NinjaOne also includes device inventory tools, so you can tag devices by age, warranty status, or role to assist with capacity planning and ensure that no device is left behind.
Want to know the answers to the most common questions IT teams and MSPs ask about RMM? Explore our RMM FAQs.
Quick-Start Guide
Capacity Planning with NinjaOne RMM
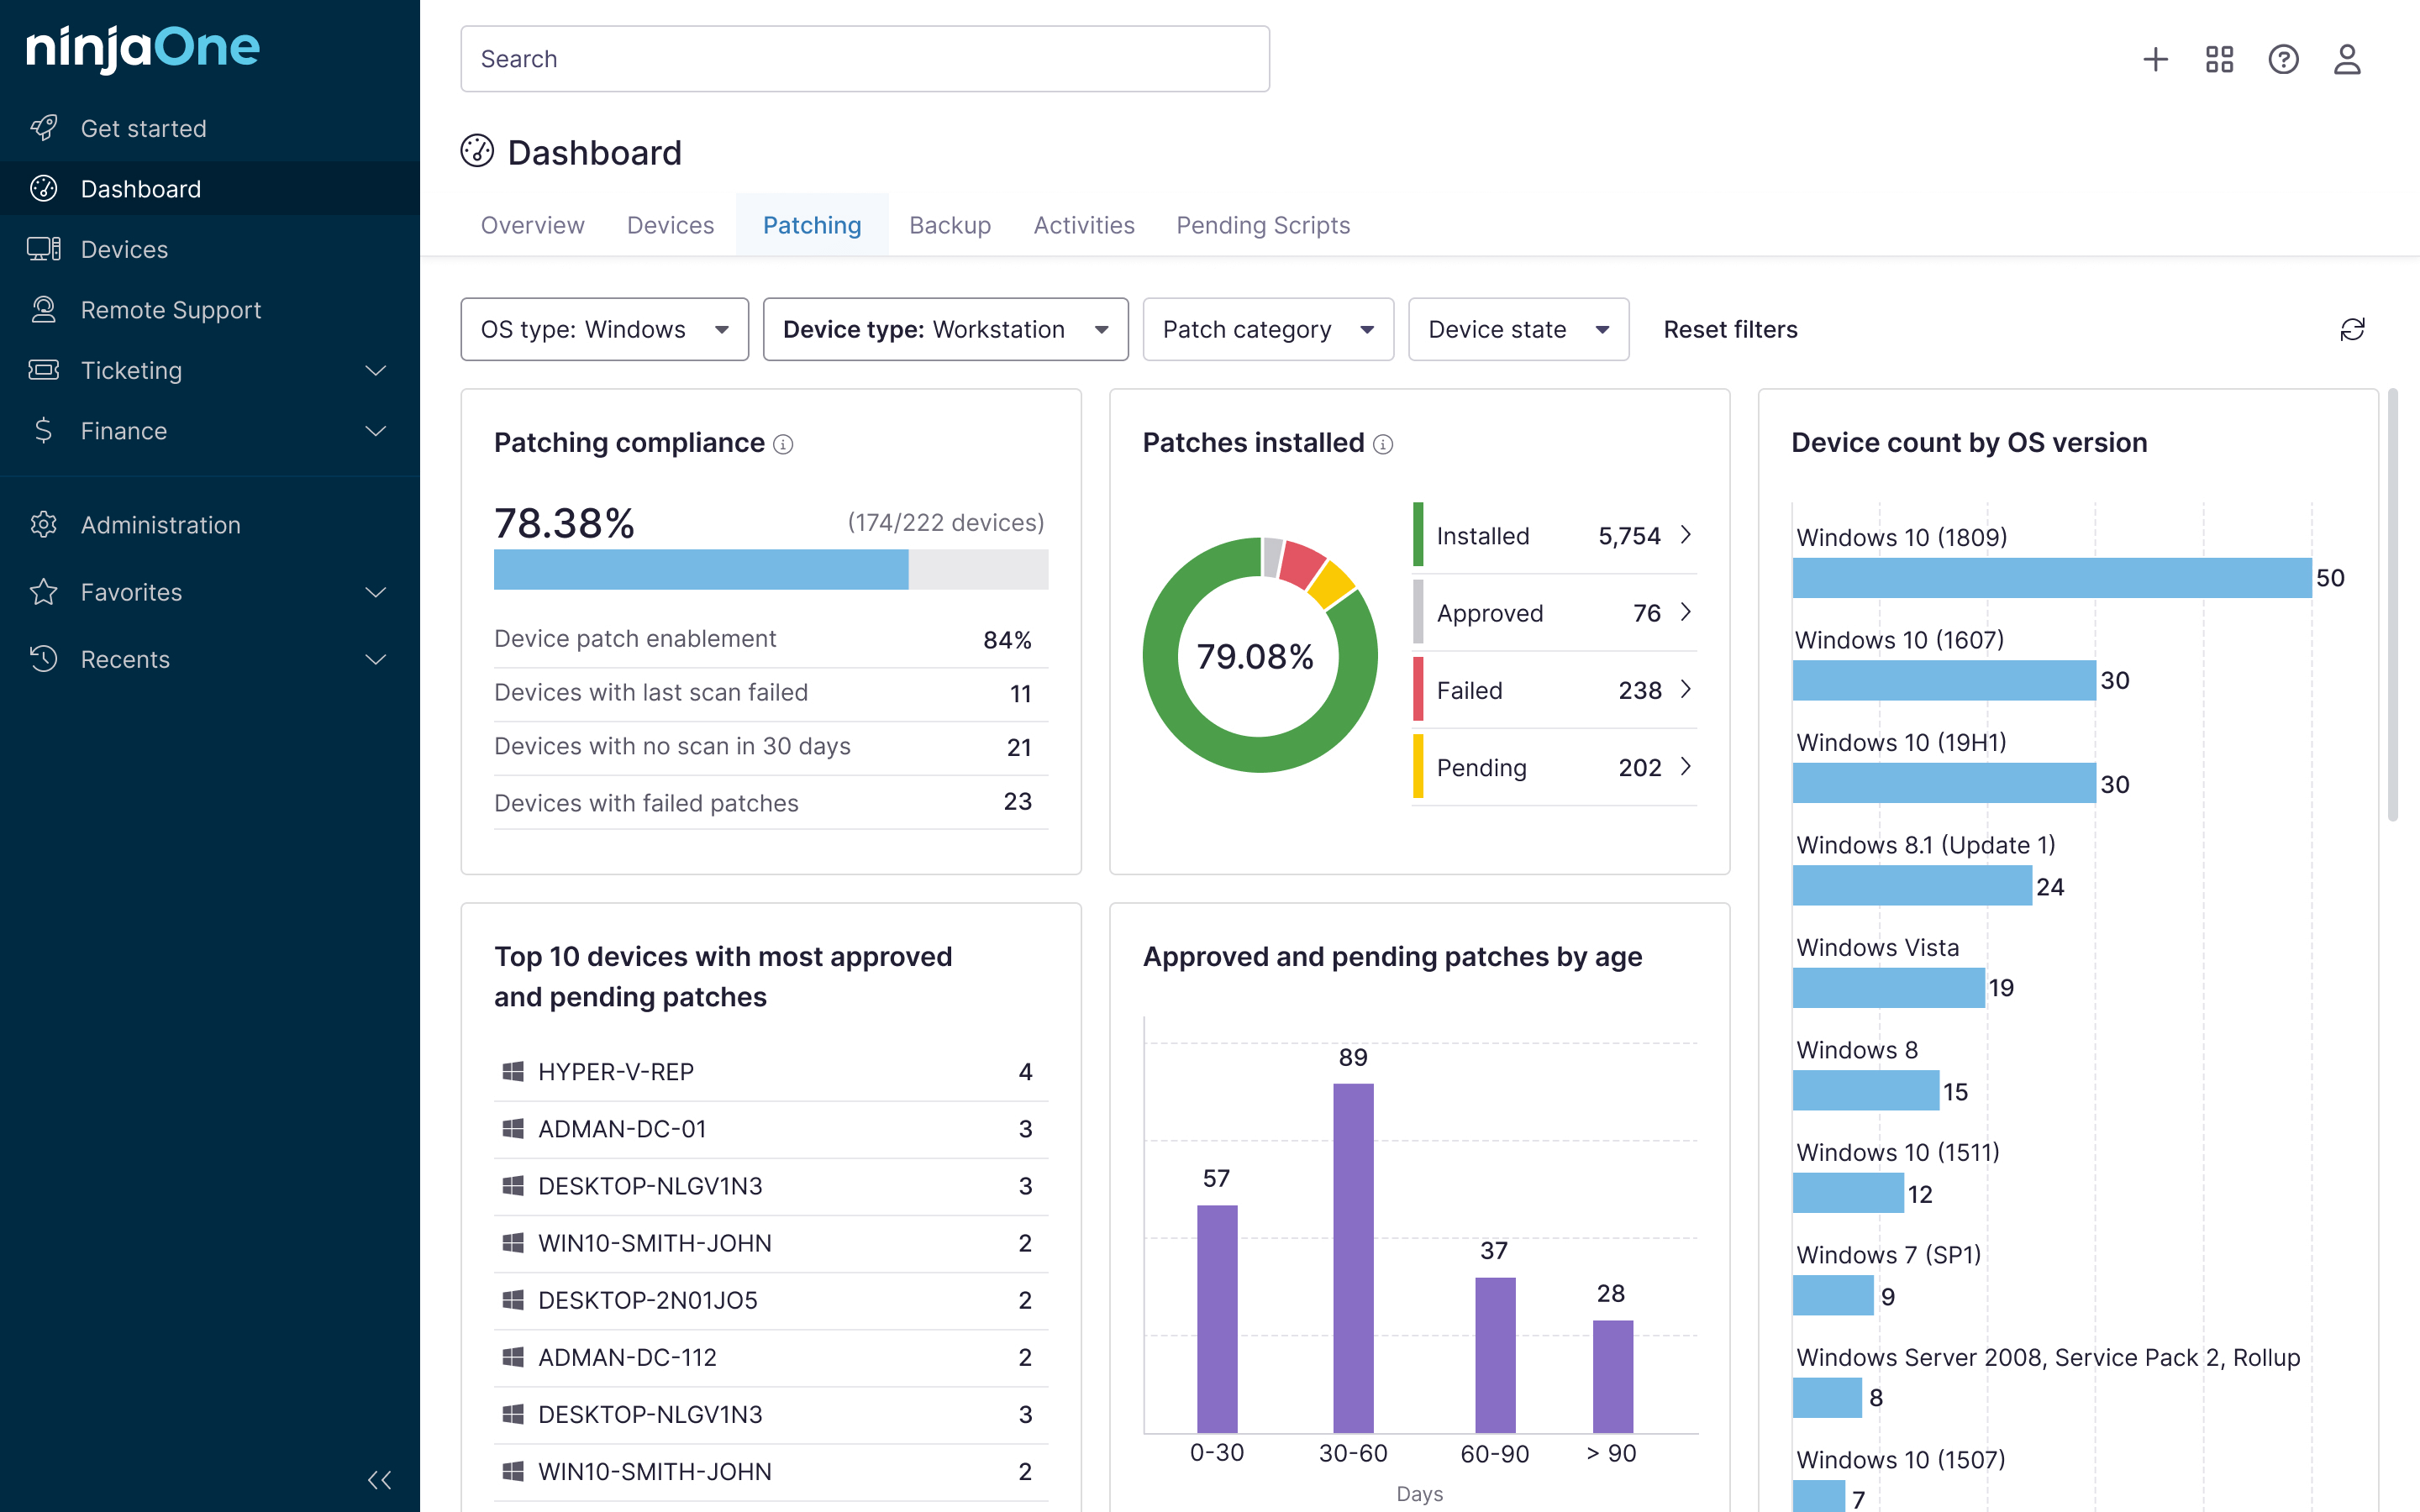
NinjaOne offers several features that can support capacity planning:
1. Device and Performance Monitoring
– The RMM allows you to track key performance metrics like:
– Device uptime
– CPU usage
– Memory usage
– These metrics help you understand the current resource utilization of your devices
2. Patch Management for Strategic Updates
– NinjaOne supports “Ring Deployments” for patching, which can be a form of capacity planning
– You can:
– Create device groups with different roles
– Stagger patch deployments across different “rings”
– Test updates on a small group before wider deployment
3. Network Management System (NMS)
– Provides monitoring for network devices like routers, switches, and firewalls
– Helps track network infrastructure performance and capacity
4. Asset Management
– Tracks device information and inventory
– Helps understand your current infrastructure and potential upgrade needs
5. Reporting and Insights
– Generate reports on device performance
– Identify trends in resource utilization
– Make informed decisions about potential upgrades or expansions
Recommended Approach
– Regularly review performance metrics
– Use ring deployments to minimize risk during updates
– Monitor device health and resource consumption
– Plan infrastructure changes based on comprehensive data


