
Key Points
- Start with KPIs that align with business objectives, and choose quality over quantity when selecting metrics.
- Keep reports simple and avoid duplicating data across overlapping reports.
- Share cloud-based reports across devices so stakeholders can access them anywhere without version issues.
- Automate scheduled report delivery to reduce manual workload and keep clients consistently informed.
It is widely accepted that technology is critical to modern businesses, but it’s often challenging to show the value Information Technology (IT) delivers to the entire organization. As a result, IT is still often viewed as a matter of “troubleshooting” or “customer support” rather than a genuinely strategic component of the organization.
Certain CIOs have successfully harnessed relevant data to demonstrate that IT is a value generator for their organizations rather than a cost center through specific IT reports. The key to such a coup is almost always the quality of the reporting, what data is quantified, and how well it illustrates the value, IT delivers to the overall business.
What is an IT report?
The familiar maxim is that every company is to some degree a technology company in today’s digital world. The issue IT professionals face is that leadership mindsets don’t always align with this idea. IT leaders manage IT service providers, and CIOs are constantly tasked with proving the value of their departments and services. Effective IT reporting is vital to accomplishing this goal as it can show the business impact of IT investments in a broader context.
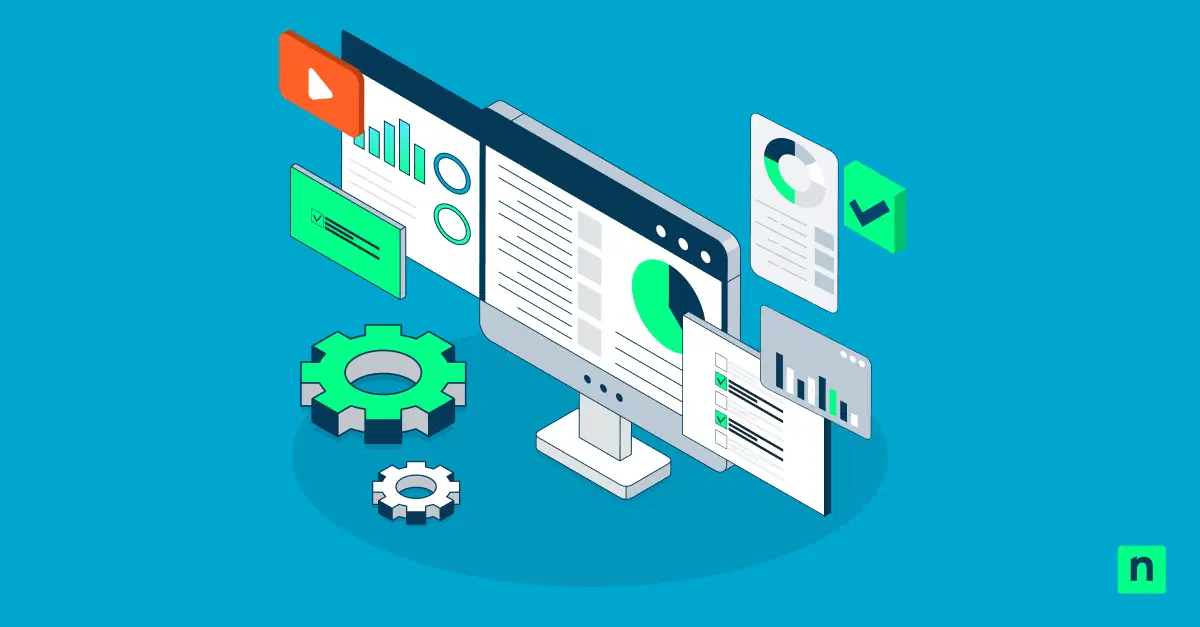
Your standard information technology report will compile and present various IT-related key performance iIndicators (KPIs) tracked over a certain period of time. These can include project management stats, helpdesk and ticketing metrics, budgetary/revenue stats, network traffic, hardware performance data, or any other relevant data points.
Regardless of the specific KPI involved, it’s important to remember that the purpose of reports is to deliver value and guide future decision-making. Therefore, these reports should align with the organization’s more significant strategic objectives and priorities.
Once you fully understand how IT aligns with business objectives, you can choose the right key performance indicators and metrics for your specific reports to explore the data and deliver the appropriate insights.
How IT professionals and MSPs use IT reports
Marketing and sales
Many managed services providers use reports in their sales and marketing processes to show the value their potential clients will receive and how their IT service stacks up against possible competitors. MSPs will commonly use service-related reports (SLA scoresheets, for example) or uptime reports to show their competency in the IT field.
Maintaining compliance
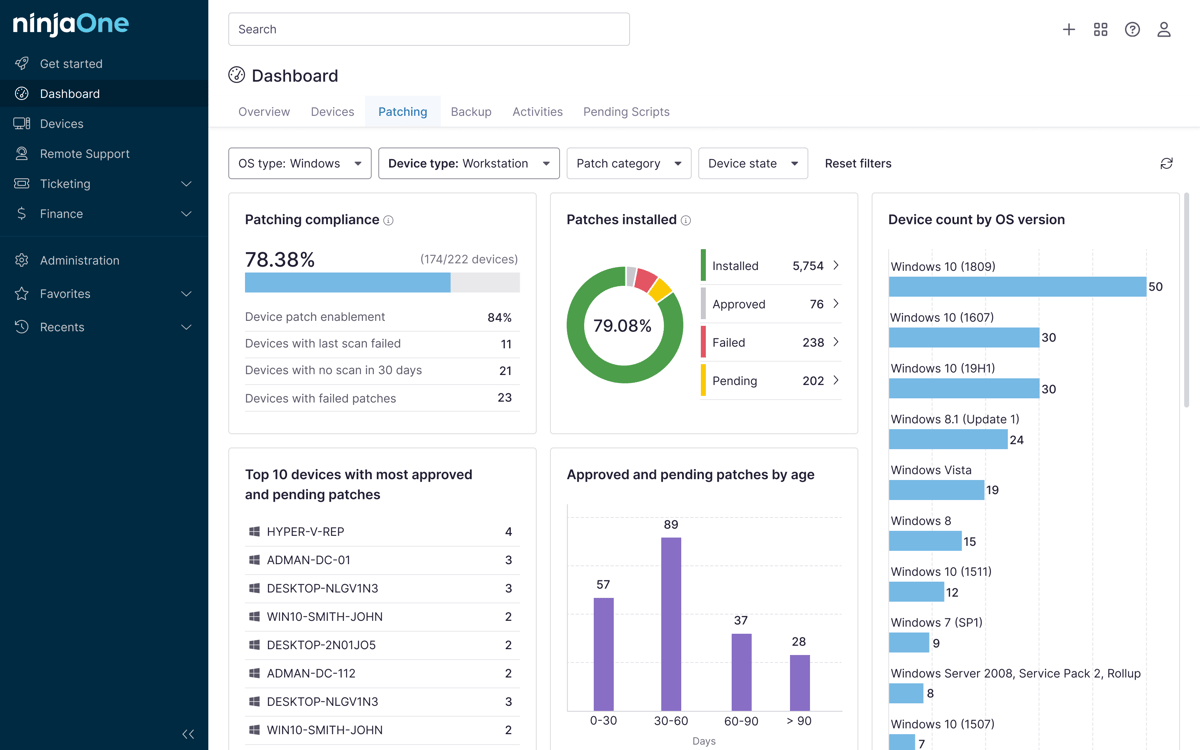
Specific regulations require that reports be generated and archived to meet standards. These reports will often focus on client system security, user access, patch management, and associated logs.
IT asset management
Reporting can be helpful, if not essential, for IT asset management, as reports can be generated to compile and sort hardware, licenses, or other assets for tracking and planning purposes.
Client retention
MSPs face the same challenge of proving the value of their IT services to their clients. Utilization, service, and budgetary reports are often used during regular meetings or quarterly business reviews (QBRs) to help keep the client engaged.
Example IT reports
Modern IT management software and reporting tools impose no limits on the types of IT reports that can be generated. Because there’s always a danger of tracking too many variables and drowning in data, it’s essential to focus on the metrics that are tied to IT and organizational objectives.
Some of the more common IT reports include:
Last period outages
Downtime and service outages directly affect a business’s ability to operate. For example, the IT team should track and report on downed communications, website outages, CRM downtime, network failures, and any other outage type that is detrimental to operations. These results should offer granular details on each outage to better understand and communicate what issues the IT team had to resolve, what effects the downtime had on the business, and what led to the problem. This is one of the crucial IT reports.
Incidents resolved within SLA timeframe
Slow response times increase the potential damage from an IT issue. The faster the MSP or IT team can respond to problems, the more value they bring to the organization. IT reports on resolution times should include the percentage of resolved incidents within the timeframe specified in the service level agreement (SLA), or measured against a more general benchmark if no SLA can be referenced.
Percentage of transactions within performance service Level
IT should report on the percentage of transactions that the department keeps within acceptable performance parameters. This helps further illustrate the importance of IT to overall operations and profitability. Even more helpful are IT reports that show a positive trend in service-level achievements as the IT environment matures and stabilizes.
Number of problems permanently resolved
Permanent resolutions are the goal of increasing productivity across the board. Recurring issues are best avoided when the IT department is looking to communicate long-term value. Tracking and reporting on recurring issues helps to guide remediation and proactive planning measures and increase overall value.
Problem management backlog aging
Effective IT reporting should include a problem management backlog summary that outlines long-standing problems that are in the queue for resolution. This IT report should be amended to include a plan to address the backlog within a given timeframe.
Number of successful changes
Change management initiatives should be tracked to document the value each change is delivering to the organization. By tracking the number and details of successful changes, MSPs can demonstrate the value each change is bringing to the table.
Change management summary
A change management summary illustrates which services are actively being developed. Good reporting should illustrate a positive trend in these changes over time.
Service availability
Service availability IT reporting is also essential to understanding continuity. For example, reporting on service availability shows that IT keeps incidents and downtime to a minimum.
Service utilization
A service utilization report will demonstrate where IT’s value is most realized by illustrating who uses IT services and how many resources they’re consuming.
Service costs
Managing the total cost of ownership is essential to running a financially efficient MSP or IT department. Service cost reports help identify expenditures across various IT services, giving insights that help reduce IT spending and budget more effectively.
Best practices for IT reports
Once you’ve taken the time to understand how to align IT data with your organization’s goals, you’ll be able to start putting together your reports within your network monitoring systems. Here are a few critical best practices to follow:
- Start with the right KPIs: Making the right choices about data points, and KPIs should be simple once you’ve evaluated your organization’s needs but do consider these choices. There is such a thing as too much data, and reports should be curated and generated using the metrics that most suit your audience and goals. Go for quality over quantity!
- Avoid overlap: Keep reports as simple as possible and do not duplicate data or allow for unnecessary overlaps between reports. When the volume and complexity of data increases, the level of frustration they can produce probably will, too.
- Work together to analyze reports: Collaborating within your organization will bring out more findings and better use the collected data.
- Share reports across multiple devices: Reports are meant to be shared, and you should be working on them as a team (see above). Cloud-based reports are not only remotely accessed and easy to share, but are also backed up to prevent any costly embarrassments due to losing a file.
- Use templates when possible: Never reinvent the wheel, right? Many RMM solutions and reporting tools (including NinjaOne) offer templates to create IT reports and live dashboards in minutes.
- Automate whenever possible: Automation is essential in the IT business, and no less so when it comes to reporting. Having reports delivered on specific days, fully automated with relevant metrics, is a great way to reduce workload while still delivering value to clients. Such automations are easily set up using a top-tier remote monitoring and management tool like NinjaOne.
The right IT reporting solution can make your life easier
For many organizations, the value of the IT department or outsourced IT provider is measured only by its ability to keep the network running. MSPs and IT professionals can change this perception by tracking the right metrics in real time and reporting them to leadership in a way that quantifies the value of the services delivered.
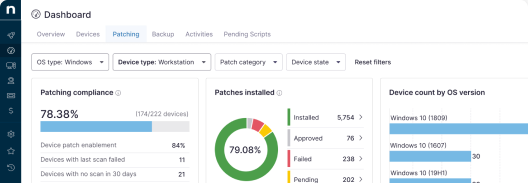
A unified IT operations platform like NinjaOne enables organizations to monitor and visualize key data in a single console. With its integrated IT reporting tools, teams can also generate focused reports for different audiences and requirements, including asset inventories, patch status, and compliance documentation. These capabilities support day-to-day operations and long-term IT planning for both enterprises and MSPs.
Related topics: