Key points
- Enable Secure Remoting: Run Enable-PSRemoting via Group Policy and configure WinRM to use HTTPS (Port 5986) with Kerberos or certificates to ensure encrypted communication across the network.
- Solve the “Double-Hop”: Use Resource-Based Constrained Delegation or a gMSA if your script needs to access a second remote resource (like a file share) to save reports or logs.
- Query Modern Classes: Use Get-CimInstance (instead of the legacy Get-WmiObject) to pull hardware data from classes like Win32_LogicalDisk, Win32_Processor, and Win32_PhysicalMemory.
- Execute at Scale: Use Invoke-Command with the -ThrottleLimit parameter to control how many machines are checked simultaneously, preventing network saturation or memory crashes.
- Modernize Reporting: Use the Microsoft Graph API (Send-MgUserMail) for email alerts to support modern authentication, and export data via ConvertTo-Json for long-term trend analysis in dashboards.
- Automate & Harden: Schedule scripts via Task Scheduler using secure credentials, and include Try/Catch blocks and Test-Connection to ensure the script handles offline endpoints gracefully.
PowerShell remote device health monitoring enables automated system diagnostics across enterprise networks through WMI queries and performance counter collection. These solutions can help you detect hardware failures, performance degradation, and service interruptions before they impact business operations.
Set up PowerShell for remote device health checks
PowerShell remote execution requires proper configuration of both source and target systems to establish secure communication channels. The Windows Remote Management service must be enabled and configured on all monitored devices to accept incoming PowerShell sessions. Authentication mechanisms, including Kerberos and NTLM, ensure secure credential transmission during remote operations.
Configure secure remote PowerShell access
To set up remote PowerShell health monitoring at scale, you’ll first need to configure remote access on all target machines.
To do that, follow these steps::
- Administrative setup for remote PowerShell: Run the Enable-PSRemoting cmdlet on each target system to configure remote PowerShell connections.
- Configure WinRM service listeners: PowerShell will create an HTTP listener on port 5985. To establish a more secure communication and follow best practices, configure an HTTPS listener on port 5986 with a valid TLS certificate. Use winrm create winrm/config/Listener?Address=*+Transport=HTTPS @{Hostname=”<hostname>”; CertificateThumbprint=”<thumbprint>”} to manually create a secure listener if needed.
- Verify administrative access: Confirm that you have administrative privileges on each monitored device before running configuration commands. Remote PowerShell setup requires elevated permissions to modify system settings and security policies.
- Harden authentication and access: Use Kerberos authentication for domain-joined systems and certificate-based authentication for non-domain environments. Avoid NTLM or Basic authentication whenever possible.
- Deploy across domain systems using Group Policy: For multiple domain-joined systems, use Group Policy deployment to streamline Enable-PSRemoting execution simultaneously across your network infrastructure.
Pro-Tip: Solving the “Double-Hop” Problem
This is the #1 reason remote scripts fail in production. If your health check script needs to access a network share to save a report or grab a file, it will fail because credentials aren’t passed beyond the first remote hop.
The Scenario: You run a script from Machine A to Machine B. If Machine B then tries to reach out to Machine C (like a central file server or a database), the connection will be denied because Machine B cannot “re-use” your identity.
The Solution: To solve this, use Resource-Based Constrained Delegation (RBCD) or run the script via a Group Managed Service Account (gMSA) to ensure the remote session has the necessary network permissions to reach the final destination.
Use Get-CimInstance for hardware diagnostics
Get-CimInstance cmdlet replaces legacy Get-WmiObject functionality for querying Common Information Model (CIM) classes on local and remote systems. This will provide more reliable hardware diagnostics and system information retrieval.
Use these key CIM classes to gather hardware data:
- Query disk space: Win32_LogicalDisk class provides disk space information, including size, free space, and file system type for storage capacity monitoring across all logical drives.
- Monitor CPU health: Win32_Processor class returns CPU specifications, utilization percentages, and thermal status (when supported) for a comprehensive processor health assessment and performance tracking.
- Check memory status: Win32_PhysicalMemory class delivers memory module details, including capacity, speed, and error correction capabilities for complete RAM diagnostics and capacity planning.
Run a PowerShell script on a remote device
Invoke-Command cmdlet executes PowerShell commands and script blocks on one or multiple remote computers simultaneously. The cmdlet establishes temporary or persistent sessions using New-PSSession for repeated operations against the same target systems.
Managing Performance at Scale
When using Invoke-Command against a large array of computers, use the -ThrottleLimit parameter. By default, PowerShell limits concurrent connections to 32.
For large enterprise environments, you can increase this to 50 or 100 to speed up your health checks, provided your management station has the CPU and RAM to handle the simultaneous WinRM sessions. Conversely, if you notice network latency, lowering this number can help reduce the immediate load on your infrastructure.
Use these key parameters to execute scripts remotely:
- Specify target systems: The ComputerName parameter accepts individual hostnames, IP addresses or arrays for bulk operations across multiple devices.
- Establish persistent sessions: New-PSSession creates temporary or persistent sessions for repeated operations against the same target systems.
- Configure authentication: The Credential parameter enables authentication with alternative user accounts possessing appropriate permissions on target systems.
Create comprehensive device health check scripts for Windows PowerShell
PowerShell health monitoring scripts combine multiple diagnostic commands into cohesive workflows that assess system status comprehensively. Script development follows modular design principles to enable reusable functions for specific monitoring tasks. Error-handling mechanisms ensure script execution continues despite individual command failures or network connectivity issues.
Check health in PowerShell
PowerShell remote device health check scripts use conditional logic to evaluate collected metrics against predefined threshold values. The Get-CimInstance Win32_PerfRawData_PerfOS_Processor retrieves raw processor performance data for utilization calculations. Comparison operators, including -gt, -lt and -eq, enable threshold-based alerting when metrics exceed acceptable ranges. Hash tables store multiple system metrics for efficient processing and report generation within a single script execution cycle.
Monitor performance counters and events
The Get-Counter cmdlet supports continuous monitoring performance through the SampleInterval parameter for repeated measurements over specified time periods. The Get-WinEvent cmdlet queries Windows Event Log entries using FilterHashtable parameter for targeted event retrieval. The MaxEvents parameter limits query results to prevent excessive memory consumption during log analysis operations.
Build error handling into your scripts
Try-Catch-Finally provides structured exception handling for PowerShell scripts executing against potentially unreachable remote systems. The Write-Error cmdlet generates non-terminating errors that allow script execution to continue after individual command failures. $Error automatic variable contains error objects for detailed exception analysis and logging purposes.
Automate recurring remote device health checks
Use task scheduling to run your PowerShell health monitoring scripts automatically on a set schedule without manual intervention. Windows Task Scheduler integration gives you robust scheduling capabilities, including retry logic and failure notifications. Credential management also ensures automated scripts execute with appropriate permissions for remote system access.
Schedule tasks with schtasks commands
Use the schtasks.exe command-line utility to schedule PowerShell scripts for automatic execution based on time intervals or system events. The /create parameter sets up a new task with a defined name, trigger and execution details. Use the /sc parameter to specify how often the task runs, whether every minute, hourly, daily or weekly. Set the /ru parameter to run the task under a specific user account with the necessary network and system permissions.
Configure recurring remote device checks
To authenticate scheduled PowerShell scripts, use stored credentials or Group Managed Service Accounts (gMSAs).. Encrypt passwords using ConvertTo-SecureString and store them in PSCredential objects to securely pair usernames with encrypted passwords. Save these credentials in Windows Credential Manager so both scheduled tasks and manual sessions can access them without exposing sensitive data.
Implement conditional logic for alerts
Use conditional logic in PowerShell to control when alerts are triggered based on health check thresholds. Leverage if and switch statements to evaluate multiple severity levels and define response actions accordingly. Track alert conditions with Boolean flags to avoid duplicate notifications from related metrics. Use timestamp comparisons to throttle alerts, enforcing a minimum interval between notifications for the same issue and preventing alert fatigue.
Test and validate
Test your PowerShell scripts against real-world scenarios and representative target systems before deployment. Use Test-Connection to confirm network connectivity and avoid unnecessary timeouts during remote operations. Add the WhatIf parameter to safely preview script actions without making changes. For deeper insight during testing, enable Write-Verbose to generate detailed logs that help you troubleshoot issues and analyze performance.
Report and respond to device health issues
Automate your reporting to turn raw health data into actionable insights for both admins and management. Set up email notifications to instantly flag critical issues that need urgent attention. Use structured report formats to track trends over time and support smarter capacity planning.
Send-MailMessage for automated health reports
Use the Microsoft Graph API and the Send-MgUserMail cmdlet to automatically email health check results and alert details to designated recipients.
Modern Emailing with Microsoft Graph
To send reports via Microsoft 365, use the Send-MgUserMail cmdlet. This is the modern standard, as the older Send-MailMessage is now deprecated and lacks support for multi-factor authentication (MFA).
Note: This requires the Mail.Send permission within the Microsoft Graph SDK.
PowerShell
M
$params = @{
Message = @{
Subject = “Daily Health Report – $($env:COMPUTERNAME)”
Body = @{
Content = $htmlBody
ContentType = “html”
}
ToRecipients = @(
@{
EmailAddress = @{
Address = “[email protected]”
}
}
)
}
}
Send-MgUserMail -BodyParameter $params
Define the sender and recipient addresses with From and To. Populate the Body with formatted summaries that include system names, key metrics and any threshold violations, giving admins immediate visibility into critical issues.
Create actionable device health summaries
PowerShell report generation combines multiple data sources into comprehensive summaries with priority classifications for efficient administrative response. ConvertTo-Html cmdlet transforms PowerShell objects into formatted HTML tables suitable for email body content. CSS styling enhances report readability through color coding and conditional formatting based on alert severity levels. Export-Csv cmdlet generates comma-separated value files for historical data analysis and trend reporting in external applications.
Future-Proofing Your Data
While HTML is ideal for immediate email alerts, consider adding ConvertTo-Json to your workflow. and piping the output to Out-File to save a local or network record.
By saving health data in JSON format, you can easily ingest these metrics into visualization tools like Power BI, Grafana, or a centralized SQL database. This allows you to track hardware degradation trends—such as a steady climb in memory usage or disk fragmentation—over months rather than just reacting to daily alerts.
Simplify system health monitoring
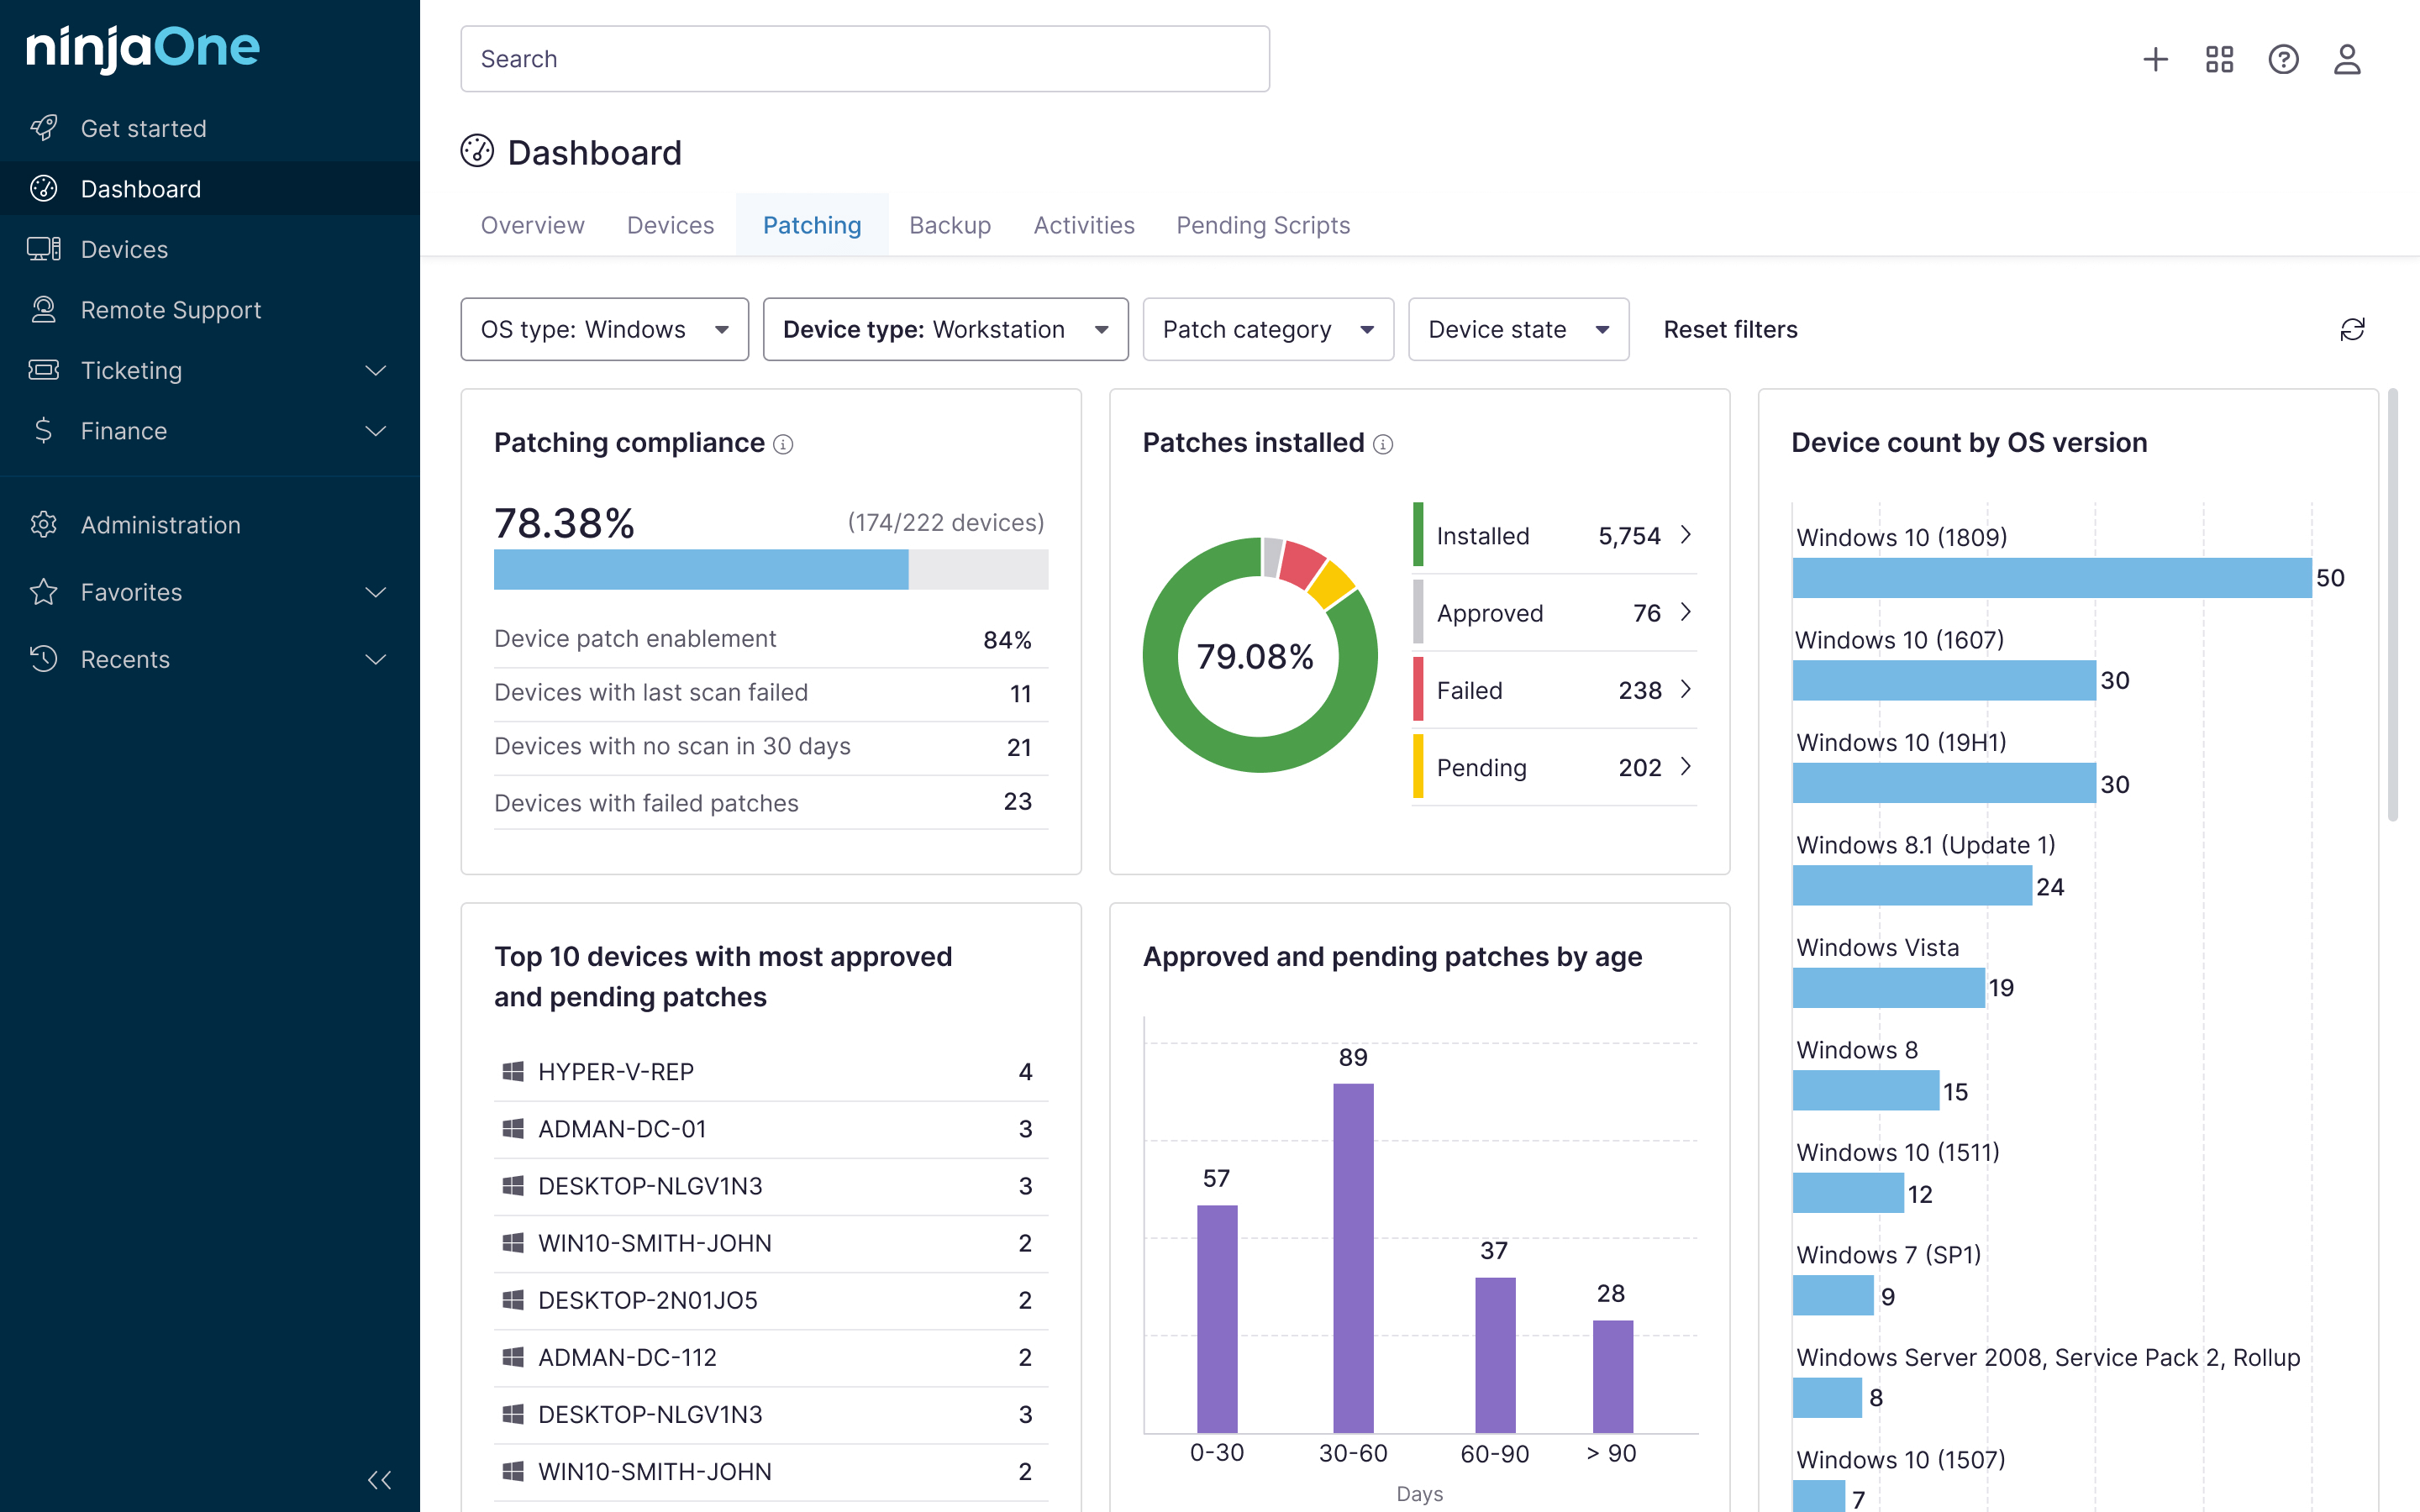
VWith NinjaOne, viewing the health of your systems has never been easier with all the options available to you. By centralizing and automating the monitoring process, Tools like NinjaOne allows you to focus on what really matters – keeping your systems running smoothly. Start using NinjaOne today and experience the difference it can make in your IT management. Try it today for free!
Quick-Start Guide
Health Check Capabilities
– NinjaOne offers several built-in scripts for system health checks, including:
– System Performance Check
– Audit Scripts (Firewall Status, PowerShell Version, etc.)
– Condition Alerts
– Device Health Issues Monitoring
Scheduling and Reporting
– You can create scheduled automations with various options:
– Run every X hours/minutes
– Run on system startup
– Run on user login
– Run once or run immediately
Example Health Check Scripts
– System Performance Check: Collects data on CPU, memory, disk, and network
– Audit Firewall Status
– Audit PowerShell Version
– Condition Monitoring
– Event Log Monitoring
Reporting Features
– Custom field storage for health check results
– Activity logging
– Dashboard views of device health status
– Export capabilities to CSV
Recommended Approach
1. Use NinjaOne’s Automation Library to select appropriate health check scripts
2. Configure scheduled automation for your desired frequency
3. Set up custom fields to store results
4. Utilize the dashboard to monitor and review device health