

Key points
- Full End-to-End Tracing is Rarely Achievable in Distributed Systems: Factors like different languages, external APIs, legacy components, and short-lived services create gaps that cannot always be closed.
- Missing Trace Data Compounds into Bigger Problems: Incomplete visibility extends resolution time and reduces confidence in monitoring data.
- Partial Visibility is Still Useful: Standardizing what can be measured and correlating it with logs lets teams fill gaps through inference.
- External Dependencies Need a Different Approach: For components outside your control, follow the trace as far as it goes, then use the correlated data to infer what is happening.
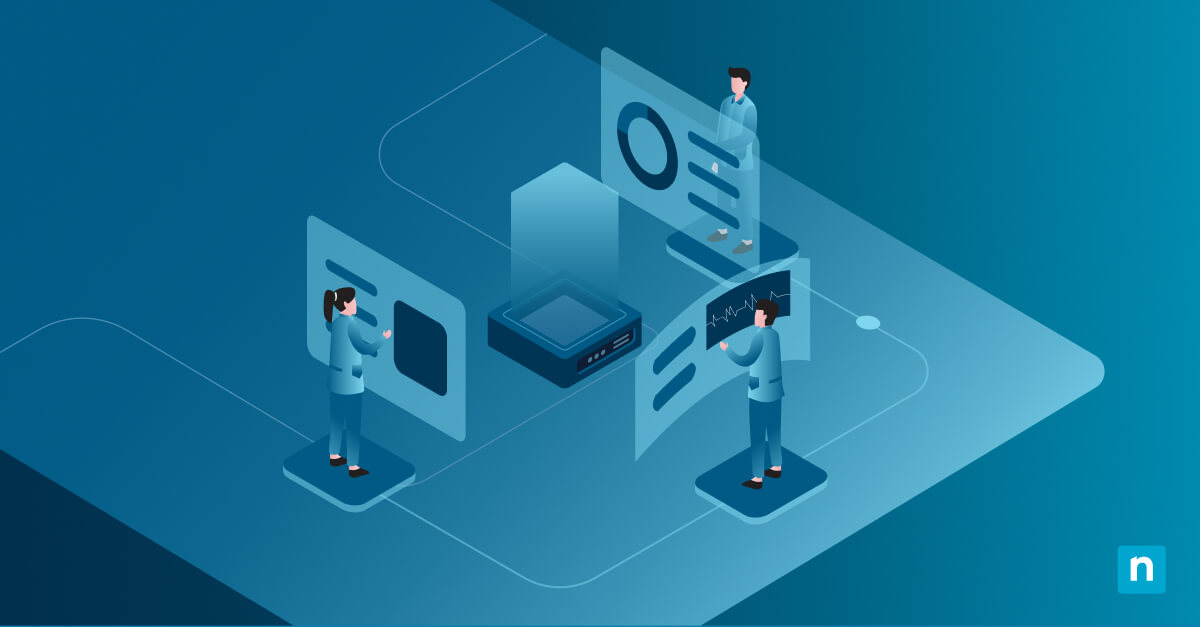
End-to-end tracing has become increasingly important to tech and DevOps teams tasked with maintaining internal tools as well as public-facing apps, but can be difficult in systems based on distributed microservices.
This guide explains what can happen when end-to-end tracing breaks (or is not possible) in distributed systems, and what can be done about it.
What is end-to-end tracing?
End-to-end tracing is the complete tracking of a request or transaction, from the initial request to its fulfilment, across every component in a system. It is commonly used to debug app code and benchmark performance, as well as find and eliminate bottlenecks.
End-to-end tracing is critical in distributed microservices-based systems where it is necessary to trace the full path of a request across multiple modular services, rather than just having to log activity from a single running codebase.
For example, when a user checks out their cart on a microservices-based e-commerce app, a request is initiated when they hit the ‘Pay now’ button. This request goes to the web server, which calls a payment processing service, which, if successful, calls an email service to send an order confirmation. This may not be linear or occur in order: if SMS order confirmation is also requested, separate email and SMS services may be called at the same time. Tracing this request is more complex than in a single monolithic codebase where everything happens in one place in a specific order.
Why end-to-end tracing is difficult to achieve in distributed systems
This can become more complex in distributed systems made up of different components that use different languages, libraries, and platforms. The ephemeral nature of scaling microservices also presents a challenge, as nodes are created and destroyed to meet demand (some existing only long enough to serve a single request). When a node is removed, so is any tracing data in it that hasn’t yet been persisted outside of it.
Other common issues that make end-to-end tracing difficult include:
- Systems that do not support tracing at all
- External services (e.g., communication APIs) without visibility
- Legacy components
- Inconsistent data formats
Databases present a particular challenge. They prioritize performance, running queries in parallel to optimize reads and writes, making it difficult to determine which specific request is causing a performance problem during high activity.
Problem: Distributed systems create observability gaps
Full end-to-end tracing requires visibility into every component. In distributed systems, these can be a mix of things such as:
- Custom code running in containers in which activity can be monitored in detail
- Cloud-native services like serverless workers that may only offer limited insights
- Third-party APIs that offer no observability
These may be running on the same host – or distributed – depending on your app. Even those in the same environment may not directly integrate, using different languages, operating systems, and requiring different libraries to monitor activity. Even distributed systems that were designed with observability in mind can eventually form gaps as they evolve.
Solution: Improving visibility without full tracing
End-to-end tracing should not be discarded even if you can’t fully trace everything. While full tracing may not be feasible for some systems, you can make sure you are consistently collecting all available data – work with what you have.
This involves ensuring that what can be measured is measured in a standardized way so that it can be analyzed and is not wasted. Where you do have control, increase integration and instrumentation to collect as much diagnostic information as possible.
Problem: The impact of missing trace data
Incomplete data, in turn, causes its own problems, including:
- Difficulty identifying root causes
- Increased time to resolve incidents
- Misinterpretation of system behavior
- Reduced confidence in monitoring data
This can undermine the usefulness of the high-quality data that you are able to collect.
Solution: Operating with partial visibility
Gaps can be filled by inference. For example, application performance monitoring can provide information that helps you infer what is happening inside ‘black box’ components, and database queries can be profiled independently in testing environments where it’s not practical to isolate activity in production.
This data can be correlated with tracing and log data, allowing you to identify patterns and fill in gaps.
Problem: System boundaries and external dependencies
External dependencies like APIs, systems running in disparate environments, as well as legacy systems that cannot be updated with tracing features, make it difficult to follow a request for its full lifecycle.
Solution: The role of context in distributed tracing
Follow as much as you can, as far as you can, using tracing tools, and fill in the gaps by correlating statistics as described above. This is only possible if you fully understand the system you are monitoring, so that you can focus on the right information, and do not wind up ‘chasing ghosts’ and trying to fix problems that are outside your control.
Improving observability for end-to-end tracing in distributed systems
Apps don’t exist in a vacuum, and are there to support real users in their daily tasks – users who can often help identify anomalous behavior. End-to-end tracing can be assisted by choosing infrastructure monitoring that can also ingest and process data from other monitoring sources and send alerts when anomalies are detected. Combined with helpdesk, both automated measures and end users can flag application issues and trigger an immediate investigation, increasing the likelihood that relevant data is captured.


