Key Points
- The strategic value of QBRs: Well-executed QBRs help MSPs showcase real business impact, justify IT investments, and strengthen long-term client partnerships.
- Turning RMM and PSA data into insights: The key to effective QBRs is translating raw operational metrics into clear, actionable insights clients can understand.
- Using standardized metrics and trends: Consistent KPIs like patch compliance, ticket performance, security posture, and device health make progress and risks easy to visualize when presented with trend comparisons.
- Building engaging QBRs with Power BI: Power BI transforms RMM and PSA exports into intuitive dashboards and visuals that clearly communicate performance to technical and non-technical stakeholders alike.
- Scaling QBRs through automation and validation: Automating data exports, validating endpoint data, and standardizing report templates ensures accurate, timely, and repeatable QBR delivery at scale.
Quarterly Business Reviews (QBRs) are some of the most important events for MSPs.
These meetings allow you to showcase the true value of your managed services by highlighting wins and recommending strategic improvements to your clients’ operations.
When done right, QBRs can help you turn regular clients into long-term partners.
However, to do this, you need to learn how to translate raw data into meaningful insights that your clients can use to make smarter IT investments.
In this guide, we’ll demonstrate how you can use Power BI and RMM exports to deliver visually engaging, data-rich IT quarterly business review templates that inform and inspire MSPs.
Turning RMM exports into engaging QBR reports using Power BI
📌 Prerequisites:
- Power BI Desktop or Power BI Pro license
- Access to PSA and RMM platforms (e.g., NinjaOne)
- Endpoint visibility via scripting, registry, and GPO
- Reporting permissions for patching, ticketing, alerts, and asset inventory
- Template directory for consistent report formatting
Step 1: Define the standard metrics and sections to be included in your QBR.
First, you must identify the core metrics you want to track and showcase on your QBR. These should include:
- Device Health: Uptime, disk usage, antivirus status, and last check-in.
- Patch Compliance: Missing updates, reboot-required devices, and compliance percentages.
- Ticket Volume and Resolution: Ticket count, SLA adherence, and reopened tickets.
- Security Alerts: Malware detection, blocked exploits, and login anomalies.
- Backup and Restore Status: Successful backup jobs, failed restorations, and last verified.
- Recommendations: Aging hardware, licensing, and endpoint upgrades.
Creating a 30/60/90 day comparison can help you highlight trends and progress over time.
Step 2: Extract your source data from your RMM and PSA tools
Next, extract your source data from your PSA or RMM platform.
Examples using NinjaOne and PowerShell
Define API Authentication
$token = “YOUR_API_TOKEN”
$auth = @{ “Authorization” = “Bearer $token” }
- Device inventory:
| $devices = @() $page = 1do { $result = Invoke-RestMethod -Uri “https://api.ninjaone.com/v2/devices?page=$page” -Headers $auth $devices += $result $page++ } while ($result.Count -gt 0) $devices | Export-Csv “Devices.csv” -NoTypeInformation Write-Host “✅ Devices exported to Devices.csv” |
- Patch report:
| $patches = @() $page = 1do {$result = Invoke-RestMethod -Uri “https://api.ninjaone.com/v2/patches?page=$page” -Headers $auth $patches += $result $page++ } while ($result.Count -gt 0) $patches | Export-Csv “Patches.csv” -NoTypeInformation Write-Host “✅ Patches exported to Patches.csv” |
- Ticket metrics from PSA:
| $startDate = “2025-04-01” $endDate = “2025-06-30” $page = 1 $tickets = @()do { $result = Invoke-RestMethod -Uri “https://psa.vendor.com/api/tickets?startDate=$startDate&endDate=$endDate&page=$page” -Headers $auth $tickets += $result $page++ } while ($result.Count -gt 0)$tickets | Export-Csv “Tickets.csv” -NoTypeInformation Write-Host “✅ Tickets exported to Tickets.csv” |
Schedule these exports to refresh before each QBR cycle to ensure data accuracy.
Step 3: Collect supplementary data from the Registry, CMD, and GPO
Validate the data you’ve gathered by performing endpoint validation checks via Registry, CMD, and GPO.
Endpoint validation checks (sampled per site)
- Last reboot (CMD):
systeminfo | find “Boot Time”
- AV status (PowerShell):
Get-MpComputerStatus | Select AntivirusEnabled, AMServiceEnabled
- BitLocker enforcement (registry):
HKEY_LOCAL_MACHINE\SOFTWARE\Policies\Microsoft\FVE
– EncryptionMethodWithXtsFdv = 7
- GPO status (CMD):
gpresult /h C:\Reports\GPOResults.html
Use your findings to support your dashboard metrics and make qualitative insights.
Step 4: Build a Power BI dashboard using RMM and exported data.
Once you’ve verified the data you have gathered from your RMM and PSA tools, you can start building your Power BI dashboard.
- Load your CSV exports from RMM/PSA into Power BI.
- Create the following data relationships:
- Ticket ID
- Device ID
- Client Name
- Generate the following visuals:
- Ticket heatmaps (volume by category and time)
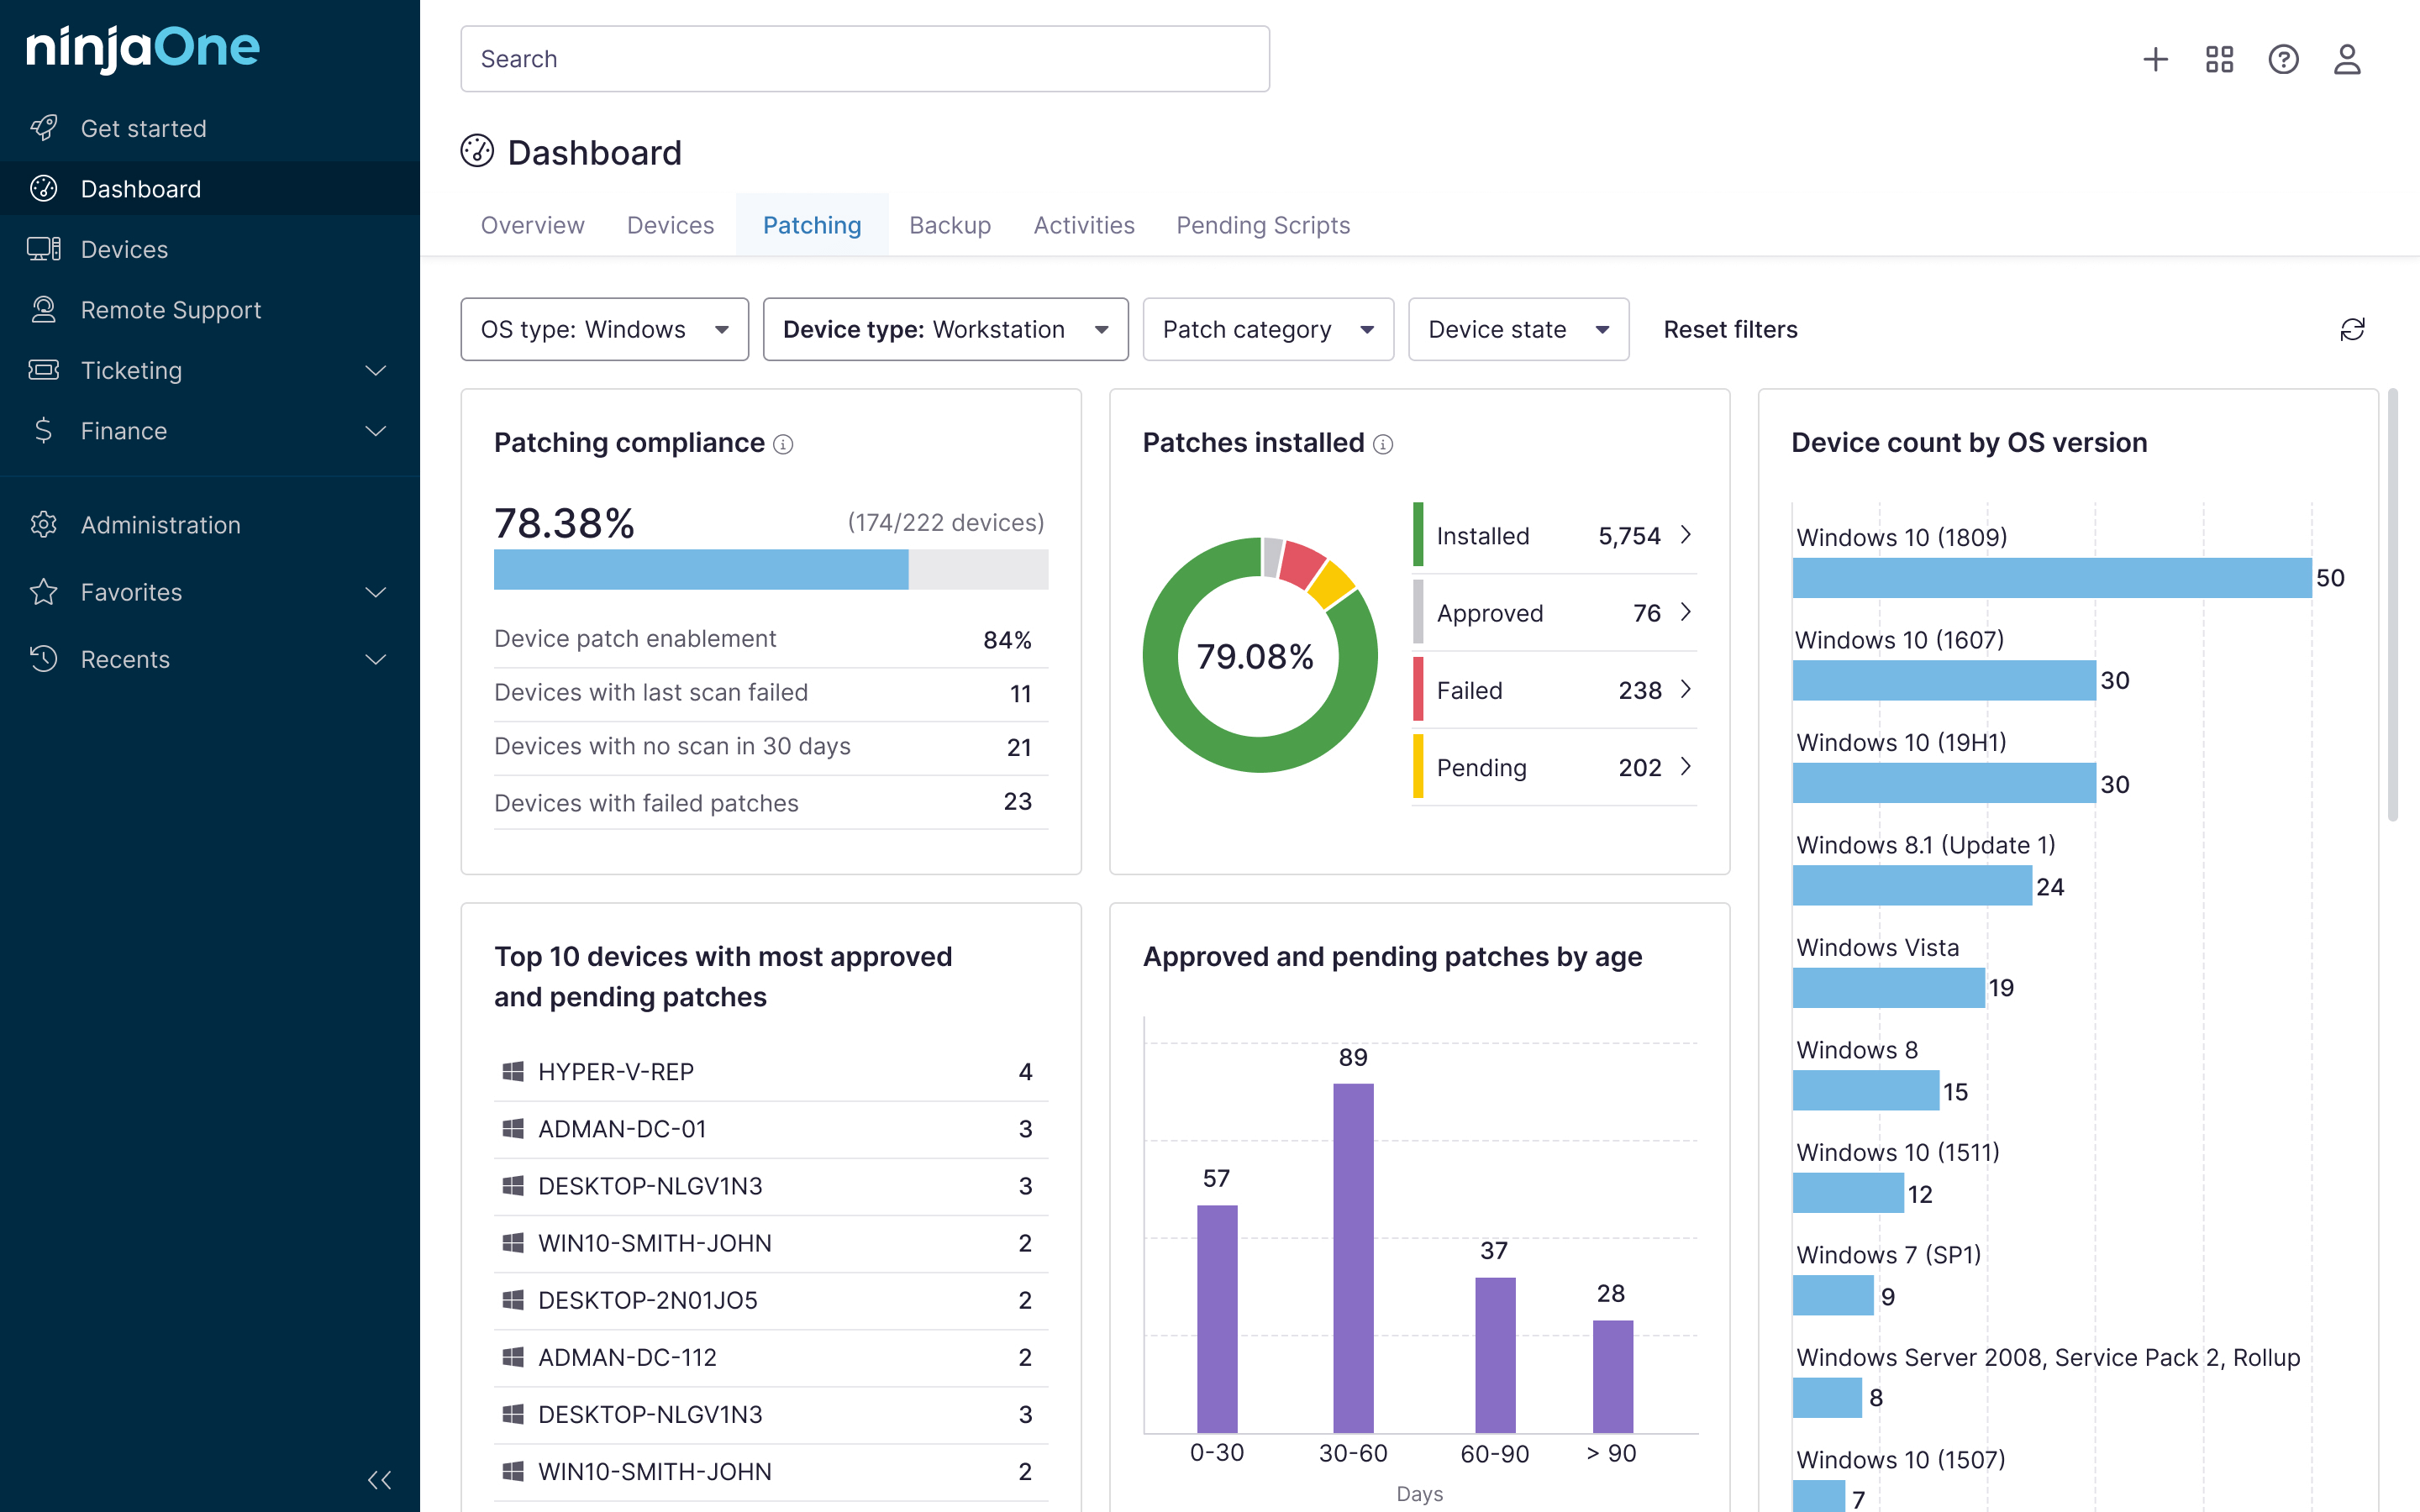
- Patch compliance donut chart
- Line chart for SLA trends over time.
- Device age matrix
- Backup status summary per site or group.
- Add slicers to filter your data by site, department, or device role.
- Publish or export your dashboard to PDF for client presentation.
Step 5: Format the QBR report for client delivery
Now that you’ve created your Power BI dashboard, it’s time to prepare your QBR report for client presentation.
Your goal here is to make your report clear, engaging, and easy to understand, even for non-technical stakeholders.
Follow the recommended structure below:
- Cover Page: Client name, date, and MSP branding
- Executive Summary: Key takeaways and high-level metrics
- Security Posture: Patching, threats, and compliance
- Support Metrics: Ticket response and resolution times
- Recommendations: Licensing, hardware upgrades, and service add-ons
💡 Tip: Include a technical appendix in your report so that IT-literate stakeholders can review your raw data, scripts, and other configuration details.
Step 6: Format the QBR report for client delivery
Finally, automate your QBR reporting wherever possible.
- Create scheduled tasks for exporting data. You can use your RMM platform’s built-in scripting features or PowerShell to schedule exports before your QBR cycles.
- Set a calendar reminder for QBR prep at least one week before your scheduled delivery date. This way, you can review and polish your report before submitting it to your clients.
- Use PowerShell’s Send-MailMessage to alert your technicians and clients once the QBR package is ready.
- Store all QBR files in version-controlled shared folders or client portals to ensure easy access.
These steps will help reduce manual errors and ensure all your QBR reports are delivered on time.
⚠️ Things to look out for
Keep these pitfalls in mind when using our guide:
| Risks | Potential consequences | Reversal |
| Blank values on Power BI | Incomplete or misleading charts; missing data in reports | Check for null fields in the CSV files and ensure. |
| Missing CMD or script data | Endpoint validation metrics will be incomplete. | Validate that the scripts have proper execution permissions and confirm if the endpoint is online. |
| Inconsistent GPO settings | Security or configuration metrics may be inaccurate or outdated. | Run gpupdate /force on the endpoint to ensure the latest Group Policy settings are applied. |
| Data refresh errors in Power BI | Outdated data on the dashboard | Confirm that the file paths to your source data haven’t changed and ensure that Power BI has access to them. |
Tips for creating meaningful and actionable QBR reports
Here are a few tips on how you can elevate your QBR reports further:
Customize your reports
Just because templates can make report generation easier doesn’t mean you should track the same metrics for all your clients.
You want to ensure that the insights you provide to your clients are relevant to their goals. Consider their size, industry, and SLAs when determining which metrics to present and how you’ll show them.
Verify your data before loading it into Power BI
Great QBR reports start with reliable data. You should always validate the data you’ve gathered before loading it into Power BI. These checks will help you avoid errors or inconsistencies in your reporting.
Use historical comparison to add depth to your reports
If you want your QBRs to deliver real value to your clients, you should include historical comparisons in your reports.
Use the data from your previous QBR reports to compare performance, highlight improvements, and identify gaps.
Make your reports readable for everyone
Not all stakeholders are IT experts, so you want to make sure they can still read and use your QBR reports.
Use plain language when presenting your data. Avoid using complex acronyms and incorporate legends into your charts to make them easier to understand.
How NinjaOne can help you streamline QBR generation
NinjaOne enables seamless QBR execution and reporting by:
- Automating data collection from multiple endpoints. including patches, inventory, alerts, and backup status
- Tagging and filtering devices by client, location, or compliance status
- Scheduling exports for ticketing, hardware, patch, and alert summaries
- Integrating with Power BI for real-time visual reporting
- Supporting technician notes and recommendations directly inside the dashboard
With NinjaOne, MSPs can deliver compelling, automated QBRs that showcase performance and drive client retention.
Build long-term partnerships by delivering insightful QBRs to your clients
QBRs are the key to building lasting client relationships. These sessions allow you to highlight the value your team has delivered to your clients and present them with personalized solutions that will strengthen their existing infrastructures.
More importantly, conducting regular QBRs positions your MSP as a trusted technical advisor rather than just a regular vendor. It demonstrates your commitment to helping your clients achieve their goals. This is where a tool like NinjaOne PSA can help MSPs. By combining billing, ticketing, documentation, and IT asset management into one platform, MSPs can easily access relevant client data that provides valuable insights for QBRs.
Related topics:
- Top 5 MSP Strategies for Using Your QBR as a Sales Tool
- Guide for MSPs: How to Use an RMM Platform
- MSP Marketing Guide: Overview, Strategies, & Tips
- How to Communicate Value as an MSP
- Complete Guide to Document Management for MSPs: Tools, Processes, and Best Practices
Quick-Start Guide
NinjaOne offers several reporting capabilities that can support Quarterly Business Reviews (QBRs):
- Reporting Features:
- Scheduled Reports: You can create reports that can be distributed daily, weekly, or monthly
- Ability to customize reports
- Export reports to PDF or CSV
- Share reports globally or with specific technician roles
- Specific Reporting Options:
- Ticketing Summary Reports
- Device and Organization Dashboards
- Vulnerability Management Reports
- SaaS Backup Insights Dashboard
- Activities Dashboard
- PSA (Professional Services Automation) Integration:
- With the recent QuickBooks integration, you can now:
- Automate billing of ticket time entries
- Generate invoices from agreements
- Synchronize invoices to QuickBooks Online
- With the recent QuickBooks integration, you can now:
For the most tailored QBR approach:
- Use the Reporting tab to create custom summary reports
- Leverage the PSA features for financial insights
- Utilize the various dashboards to gather comprehensive data


