

Key Points
- What Is Reliability History? The Windows Reliability Monitor is a built-in tool in Windows 10 and Windows 11 that visually tracks system stability using a System Stability Chart and Reliability Index (1–10 scale).
- Why Use the Reliability Monitor? It simplifies troubleshooting by highlighting software crashes, failed updates, and system errors, offering a visual alternative to Event Viewer for diagnosing PC reliability issues.
- How to Open Reliability History: Access it by typing “reliability” in Settings search or directly launch it with the perfmon /rel Run command for faster access.
- Interpreting the Stability Chart: Track daily or weekly system health through graphical icons:
- ⓧ Errors = Crashes or critical failures
- ⚠ Warnings = Noncritical issues like low memory
- ⓘ Information = Successful updates or actions
- View Technical Details: Click on specific dates or events in the chart to examine detailed reports and troubleshoot based on event data and crash causes.
- Troubleshooting with Reliability History: Identify and fix PC instability by updating drivers, reinstalling failing applications, running sfc /scannow, and resolving Windows Update failures.
- Limitations to Note: The Reliability Monitor shows data for only 28 days and lacks some system-level details; use Windows Event Viewer for deeper diagnostics.
This guide explains how to view Reliability History in Windows 10 and Windows 11. Additionally, it will help you diagnose problems with your Windows device, including troubleshooting hardware and software issues as well as assessing the stability of your system using the Stability Index and System Stability chart.
What is the Windows Reliability Monitor?
The Reliability Monitor is a built-in tool in Windows 10 and Windows 11 that displays a graphical timeline of the reliability history: events that affect the stability of your Windows PC in the form of a System Stability Chart. This includes the Reliability Index, a number from 1 to 10 (with 10 being the most stable) that indicates the overall stability of your system.
Why view the reliability history in the Reliability Monitor?
By analyzing the Reliability Index and looking for drops in its value, you can view the events that may have caused the recorded instability. This provides an alternative to using the Event Viewer to manually hunt down logged events (for example, software crashes and Windows updates) for a given period where the system may have been unreliable or encountered a problem.
Periodically reviewing the reliability history using the Reliability Monitor can also help identify problems you were not aware of, such as performance issues or failed updates.
Scale reliability history monitoring across every device with NinjaOne RMM.
Step-by-step guide: How to view reliability history in Windows 10 and Windows 11
- Right-click on the Start button
- Click Settings
- In the Find a setting search box, enter “reliability”

- Click on View reliability history in the search results
Alternatively, you can press Win + R and run the command perfmon /rel to launch the Reliability Monitor.
For a clear walkthrough, please watch this video: ‘Complete Guide: How to View Reliability History in Windows 10 and Windows 11’.
Interpreting the reliability history
The System Stability Chart and Reliability Index provide several pieces of information that can tell you the possible cause of system instability.
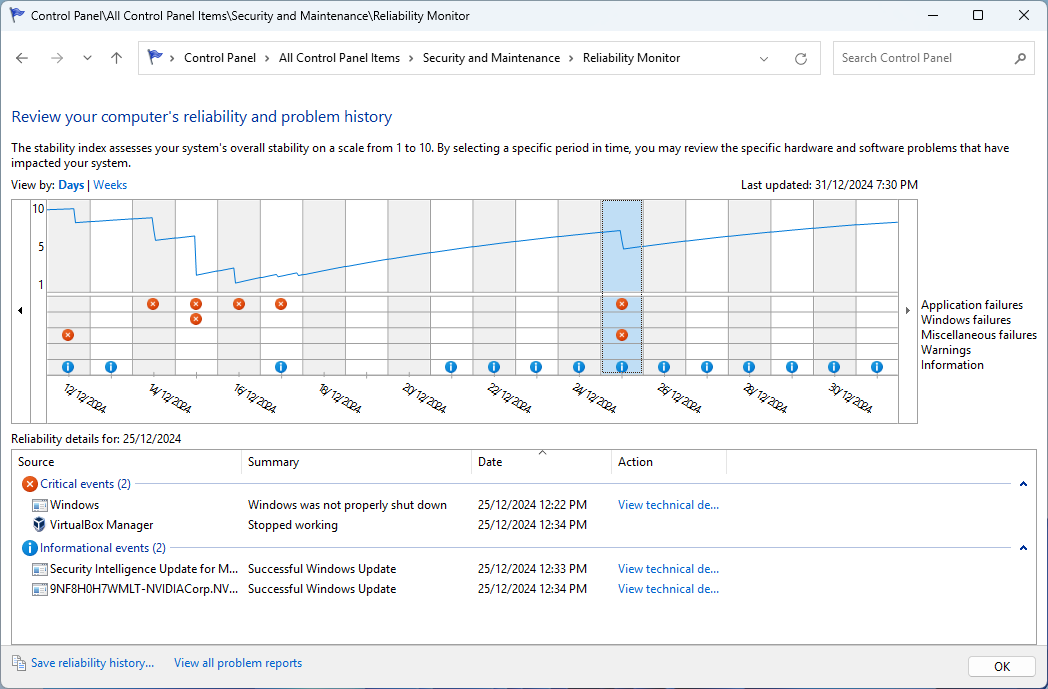
In particular, the chart shows the index tracked over the selected time period (days or weeks), as well as a summary of application failures, Windows failures, miscellaneous failures, warnings, and information alerts. If there is not enough information to calculate a reliable index, it will be shown as a dotted line rather than a solid line.
The icons in the chart have the following meanings:
- ⓧ Errors are events that resulted in a failure or crash that has directly affected system reliability.
- ⚠ Warnings provide information about events that may require attention or cause instability, but that did not throw a critical error, for example, low memory or disk space.
- ⓘ Information indicates that an event that may be relevant to system stability was successful, for example, the installation of a Windows Update
Clicking on a column in the chart will then show you the detailed information for that period. The screenshot above, that the Reliability Index dropped on 25/12/2024 due to the program VirtualBox Manager crashing and Windows failing to be shut down properly.
Clicking on View technical details in the Action column of the Reliability details table shown below the graph displays detailed information about the event to assist with further troubleshooting.
You can also click View all problem reports to list all the reportable events in a single list rather than have them distributed across the Reliability chart.
Tips for using reliability history effectively
Once you have identified the possible cause of system instability, you can take measures to address it by doing the following:
- Ensuring your system is up to date and troubleshooting Windows Update issues
- Re-installing software that is failing and making sure it is at its latest version
- Updating device drivers
- Checking and repairing your system using sfc /scannow
Limitations of reliability history in the Windows Reliability Monitor
While the Reliability Monitor is a useful troubleshooting tool for Windows 10 and Windows 11, it only covers a limited timespan (only 28 days by default). It is also limited in the events it displays, and the amount of detail about those events.
If the cause of system instability can’t be determined using the Reliability Monitor, the Windows Event Viewer can be used to view comprehensive, detailed information about your system’s behavior, such as than on problems.
Gain visibility over your Windows computers, including reliability history with NinjaOne.
Monitoring the reliability, stability, and performance of multiple PCs
Tracking the system performance of multiple Windows 10 and Windows 11 devices in enterprise environments requires additional tools. The Reliability Monitor assists with troubleshooting but must be run manually, which can be inefficient and time-consuming when managing more than a handful of devices.
Remote monitoring and management (RMM) by NinjaOne allows you to remotely monitor and assess the reliability history of fleets of Windows PCs (as well as Apple, Android, and Linux devices) anytime and from anywhere. With automated alerting and remediation, you can proactively address the causes of system instability on your endpoints before they can affect productivity.


