Key Points
- Measure patch caching ROI with targeted audits: Evaluate bandwidth savings, cache hit rates, and patch delivery performance across clients to determine whether patch caching is delivering measurable value.
- Use Delivery Optimization data to validate efficiency: Analyze Windows Delivery Optimization metrics via PowerShell, dashboards, or monitoring tools to compare local cache usage against direct CDN downloads.
- Verify patch compliance and deployment timelines: Review WSUS or Intune reports to confirm update success rates, identify delays or failures, and ensure patches meet defined compliance targets.
- Align audit results with service-level objectives: Compare caching performance and compliance data against SLAs to demonstrate improvements in update speed, reliability, and network utilization.
- Report outcomes in business-relevant terms: Translate technical metrics into clear results—such as bandwidth reduction and improved compliance—to support stakeholder visibility and ongoing investment decisions.
Leveraging patch caching through solutions like WSUS or Delivery Optimization slashes bandwidth usage and speeds up update deployments. Yet, to prove this efficiency and maintain compliance, conducting a regular patch audit is essential.
This guide will show you how to measure caching performance with tools you already have, turning data into actionable insights.
Steps for patch caching, auditing, and analysis
Enabling caching is just the first step. To validate its value, you must audit for three key outcomes: genuine bandwidth savings, high cache hit rates, and maintained patch compliance timelines.
📌 Use case: Conduct a patch analysis at critical points: after initial setup, following major Patch Tuesday updates, during compliance reviews, or if you notice slow deployments or network strain.
📌 Prerequisites: Before starting, ensure you have:
- Administrative access to clients and servers
- Basic PowerShell or command-line skills
- Access to your management console (WSUS, Intune, etc.)
- Defined success metrics (e.g., target bandwidth reduction, patch SLA)
Step 1: Collect delivery optimization metrics
To confirm your patch caching is reducing bandwidth consumption, audit Delivery Optimization (DO) on Windows 10 and 11 using these methods.
Step-by-step procedure:
A. Use cloud-based reports for a broad view
- Access the Windows Update for Business reports in the Microsoft Intune admin center.
- Ensure devices are Microsoft Entra joined (not just registered), on supported Windows 10/11 with the Feb 2023 cumulative update or later, sending required diagnostic data, and able to reach Windows diagnostics/Update endpoints.
- Review the pre-built dashboards showing bytes from peers vs. CDN over the past 28 days.
- Use a Log Analytics workspace in a supported region and give viewers Log Analytics Reader (or Contributor); Delivery Optimization data is cloud-managed, excludes Windows Insider devices, and only shows for devices with activity in the last 28 days.
- Run KQL in your Azure Monitor Log Analytics workspace and query UCDOAggregatedStatus (Delivery Optimization metrics) to compute cache-hit rates.
B. Check individual clients with PowerShell
- On a Windows 11 device, open PowerShell as an administrator.
- Run Get-DeliveryOptimizationPerfSnapThisMonth for a summary of total bytes from peers and the internet.
- For real-time data during an update, use Get-DeliveryOptimizationStatus and note PercentPeerCaching and BytesFromPeers.
This quick patch audit provides immediate evidence of bandwidth savings and cache efficiency.
Step 2: Measuring Delivery Optimization performance
In distributed networks, auditing Delivery Optimization confirms that update traffic is served locally rather than crossing your WAN.
Step-by-step procedure:
- Open Performance Monitor on a representative client (run perfmon.exe).
- Add Delivery Optimization counters.
- Click +, expand Delivery Optimization, then add:
- BytesFromPeers (bytes downloaded from peers)
- BytesFromHttp (bytes downloaded from Microsoft CDN/HTTP source)
- BytesToPeers (bytes uploaded/shared to peers)
- Collect during a patch cycle, then export the counter log to CSV for reporting and trend analysis.
- For a quick signal, compute peer share % as BytesFromPeers / (BytesFromPeers + BytesFromHttp) × 100.
After the procedure, you’ll have concrete data to calculate your cache hit ratio and total bandwidth saved.
Troubleshooting: Why is my Peer Caching 0%?
If your audit shows no peer activity, check these three settings in your RMM or Group Policy:
- Download Mode: Ensure it is set to Mode 1 (HTTP blended with Peering behind same NAT) or Mode 2 (Private Peering/Group ID).
- Minimum RAM/Disk: By default, DO won’t trigger on devices with less than 4GB RAM or small disk buffers.
- Network Profile: Peering is often disabled by default on networks identified as “Public.” Ensure your office networks are set to “Private.”
Step 3: Review WSUS or Intune compliance reports
Your central management consoles provide the definitive data for a patch audit.
For WSUS/Configuration Manager
Generate built-in reports like Update Compliance or Computer Status to see installation success rates across your environment. These reports are essential for proving compliance timelines and identifying failed deployments.
For Intune/Windows Update for Business
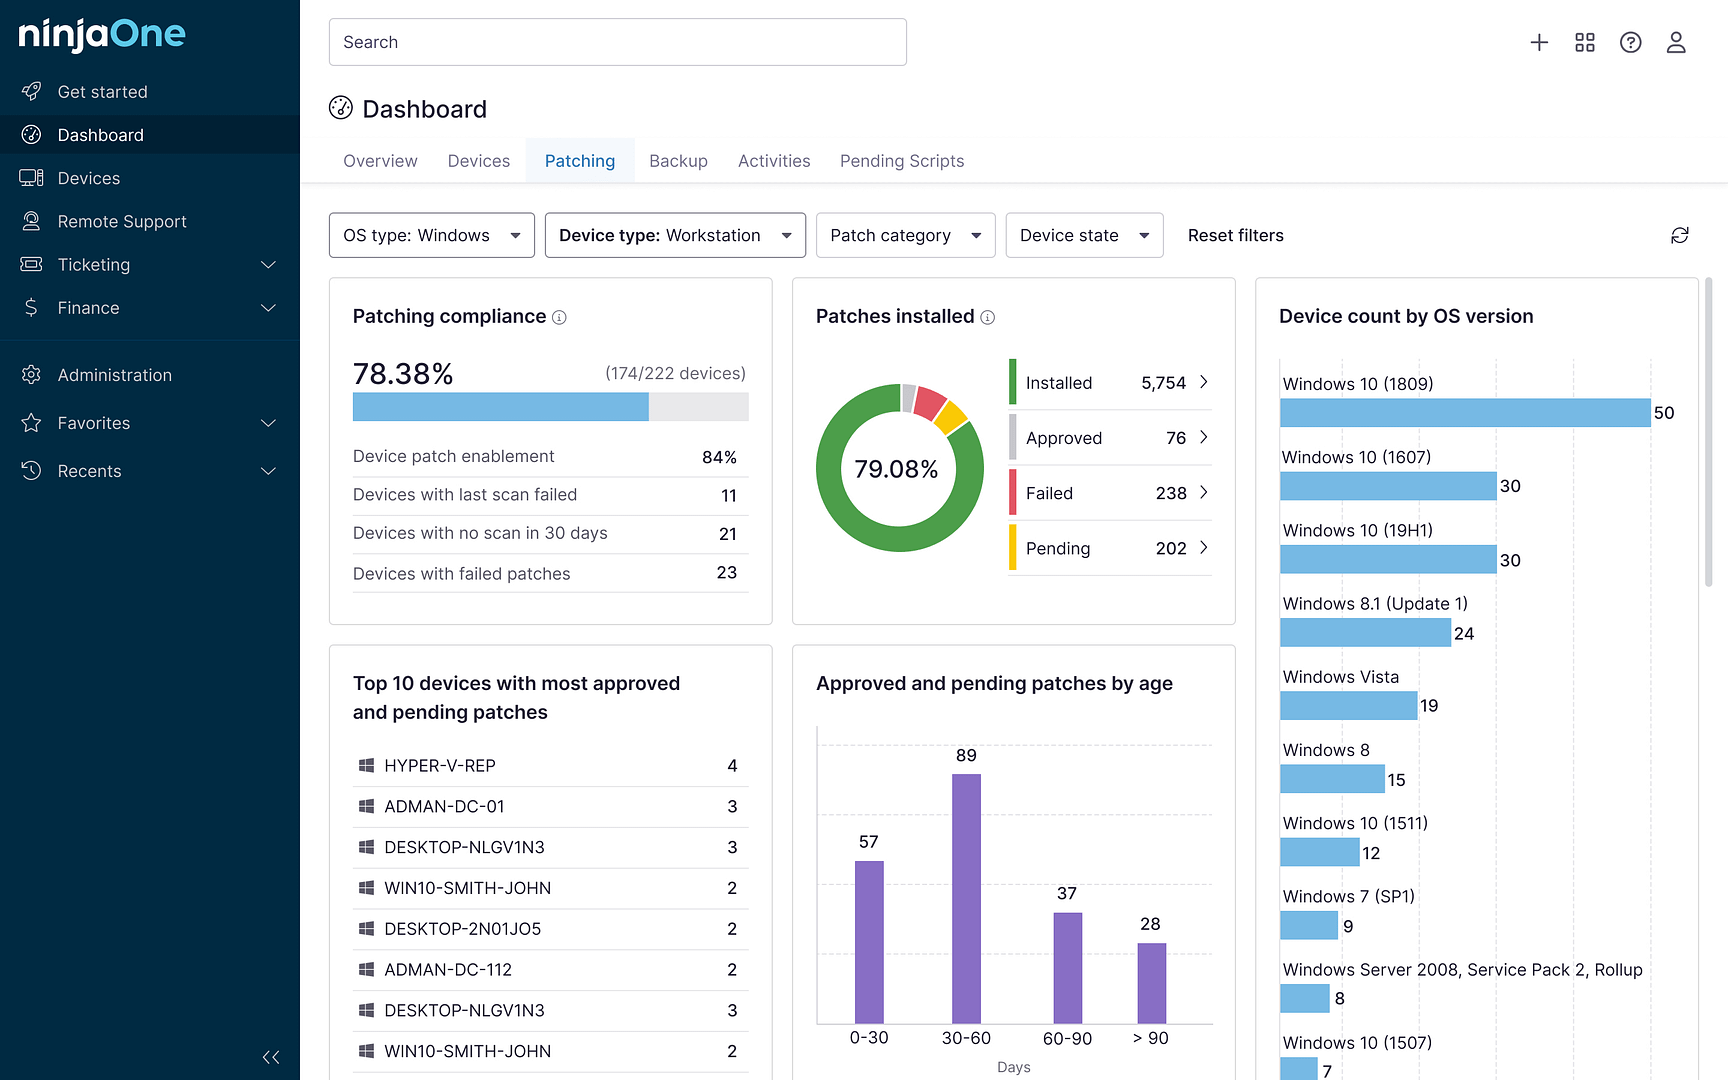
Use the cloud-based Windows Update for Business reports in the Intune admin center. These dashboards show deployment status, compliance %, and Delivery Optimization savings.
Note: Note: WUfB reports appear only after the feature is enabled and your tenant is linked to an Azure Log Analytics workspace; without this setup, the dashboards won’t display data. Where to find it: Intune admin center > Reports > Windows updates > Windows Update for Business reports.
Step 4: Compare results against compliance targets
Measure your audit findings against clear SLAs to prove effectiveness.
Validate against SLAs
Compare actual patch compliance rates and timelines against targets like “95% patched within 7 days.” Identify devices with failed or unknown status that are missing deadlines.
Quantify bandwidth savings
Calculate your cache hit ratio from collected data. Check if it meets targets such as “50% WAN bandwidth reduction,” which justifies your caching setup.
Document for accountability
Record metrics and gaps in a Caching Audit Register. This creates a baseline for future comparisons and demonstrates tangible value to stakeholders.
Step 5: Report findings to stakeholders
Translate technical metrics into clear business value to demonstrate the ROI of your patch management strategy.
Focus on business outcomes
Present findings using tangible benefits rather than technical specs. For example:
- “Our patch caching system saved 300 GB of WAN bandwidth this quarter, reducing network costs.”
- “90% of devices met compliance deadlines using local cache sources, minimizing security risks.”
Pro-Tip: The “Bandwidth Congestion” Argument Instead of just reporting 500GB saved, frame it as “Time Reclaimed.”
- Standard Update: 100 machines downloading a 1GB update simultaneously = 100GB hitting your firewall.
- Cached Update: 1 machine downloads the update, 99 pull locally = 1GB hitting your firewall.
Result: You prevented a 99% network slowdown, ensuring VoIP calls didn’t drop and cloud apps stayed responsive during Patch Tuesday.
Contextualize the Results
Compare current performance against previous periods or industry benchmarks. Statements like “This represents a 40% improvement over last quarter’s bandwidth usage” make the progress clear to non-technical decision-makers.
Schedule Strategic Presentations
Share these results during Quarterly Business Reviews (QBRs) or budget planning meetings. This evidence supports continued investment in IT infrastructure and validates the effectiveness of your current patch auditing process.
Ideal Touchpoint Example Workflow
Implement this three-step procedure to automate patch caching audits.
Step-by-step procedure:
- Schedule weekly data collection.
- Create a scheduled task that runs this PowerShell command weekly:
Get-DeliveryOptimizationPerfSnapThisMonth | Export-CSV “C:\Audit\DO-Metrics.csv” -Append
- Centralize reporting in your RMM platform.
- Upload the generated CSV files to your documentation system, like NinjaOne, organizing them by client and date.
- Build automated compliance dashboards.
- Use your RMM’s reporting features to visualize patch compliance metrics such as update success rates, device patch timelines, or overall compliance trends.
This automated workflow ensures consistent audit data collection and provides always-available evidence of patch management effectiveness.
Is Peer Caching Secure?
A common audit question from clients is whether peer-to-peer patching introduces risks. The answer is no. Delivery Optimization uses the same security requirements as Windows Update: it verifies the file hash and authenticity of every piece of data against Microsoft’s official metadata before installation. A compromised peer cannot “inject” a malicious patch into another client.
5 common patch auditing mistakes to avoid
This section highlights potential challenges to keep in mind while following this guide.
| Risk | Cause | Reversal / Solution |
| Skipping the baseline measurement | Auditing caching without first knowing your normal bandwidth usage or patch deployment times. | Always record a baseline before making changes. You can’t prove savings without a starting point. |
| Misconfiguring delivery optimization policies | Editing Registry or Group Policy settings for DO without a backup, potentially breaking the service. | Always back up configurations before changes and use centralized management tools for easy reversal. |
| Trusting cloud dashboards without spot-checks | Assuming high-level Intune reports are 100% accurate for every device. | Correlate cloud data with periodic PowerShell checks (Get-DeliveryOptimizationStatus) on sample clients to validate findings. |
| Automating data collection incorrectly | Using a scheduled PowerShell script that overwrites last week’s data instead of appending to it. | Always use the -Append parameter with Export-CSV and test scripts thoroughly in a non-production environment. |
| Blaming caching for network issues | Assuming a low cache hit rate is always a caching problem, when it could be firewall rules or general latency. | Rule out basic network connectivity issues before diving deep into cache configuration analysis. |
Leverage NinjaOne to automate patch caching audits
An RMM platform like NinjaOne transforms patch caching audits from a manual chore into an automated, centralized process.
- Automated data collection: Execute customized PowerShell scripts across all endpoints to simultaneously gather Delivery Optimization metrics, replacing hours of manual checks.
- Maintain audit-ready documentation: Securely store all historical metrics, reports, and findings in NinjaOne Documentation, creating permanent client records for compliance reviews.
- Generate internal performance dashboards: Use NinjaOne’s reporting tools to visualize patch compliance and performance metrics, helping IT managers assess ROI and communicate results during client reviews.
- Enable proactive performance alerts: Configure automated alerts in NinjaOne that notify you when custom PowerShell monitoring scripts detect low cache hit rates or performance issues.
By integrating these steps, NinjaOne not only automates the patch audit but also turns the data into actionable business intelligence for stakeholders.
Ready to automate your patch audits? See how NinjaOne helps schedule scripts, store client data, and validate execution with detailed logs.
→ See how NinjaOne can measure patch caching effectiveness
Streamline your patch audit to prove tangible value
A rigorous patch audit transforms patch caching from an assumed benefit into a proven asset, demonstrating clear ROI to clients and ensuring compliance.
By leveraging native tools like PowerShell for bandwidth metrics, Performance Monitor for Delivery Optimization performance, and Intune/WSUS dashboards for compliance, you gain data-driven insights without extra costs.
Consistently measuring these outcomes against SLAs allows you to refine your strategy and present findings in business terms, turning technical data into compelling client conversations.
Related topics


