SNMP Monitoring with NinjaOne for Smarter IT Management

SNMP monitoring is essential for IT teams that want complete visibility into their network devices. NinjaOne simplifies SNMP network monitoring by providing a unified, cloud-based solution that tracks performance, detects anomalies, and helps prevent downtime.
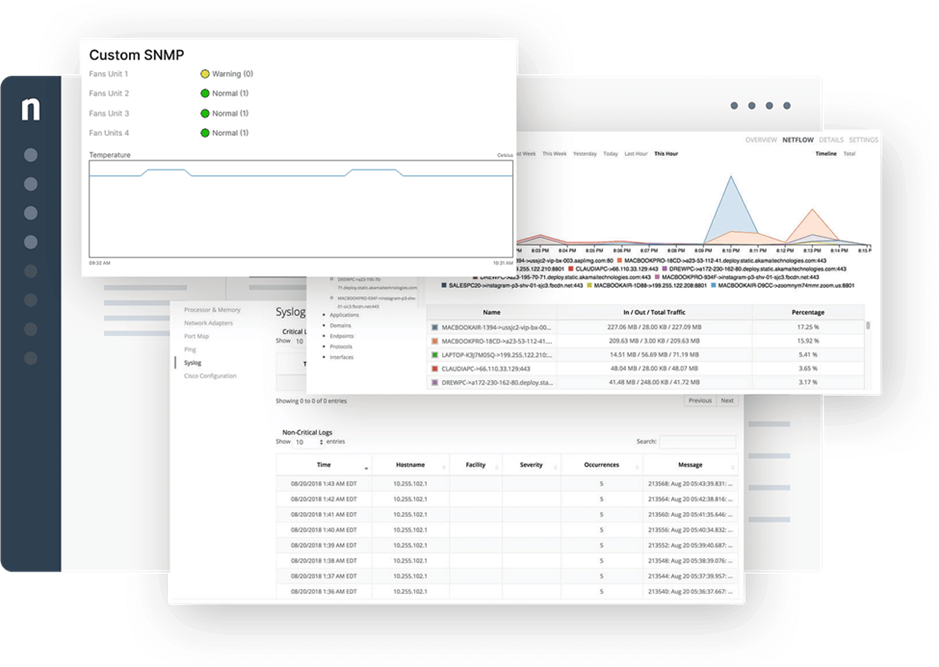
SNMP Monitoring
IT business logo
Provide logo
Advantage Technologies logo
Dedicated IT logo
Alticap logo
Network Coverage logo

Why IT teams choose SNMP monitoring with NinjaOne

Unified network oversight 

NinjaOne brings all your SNMP monitor data together in a single, intuitive view so IT teams can instantly see network health and performance. 

Faster troubleshooting and resolution 

With proactive alerts and live device metrics, issues are detected and resolved quickly, keeping downtime to a minimum. 

Scalable monitoring that grows with you 

Whether managing a small office or enterprise infrastructure, NinjaOne’s SNMP monitoring tools adapt seamlessly to fit your needs. 

Security built into every connection 

SNMP agent data is collected through encrypted communication with role-based access controls, providing enhanced monitoring security. 

Proactive automation that prevents issues 

Automated responses tied to SNMP events allow teams to fix problems before they disrupt business operations. 

Actionable insights through reporting 

Detailed reporting from SNMP network monitoring tools highlights trends, capacity, and performance benchmarks for smarter decision-making. 

Advanced SNMP device monitoring capabilities with NinjaOne

Centralized device visibility 

Monitor routers, switches, firewalls, and any SNMP device directly in NinjaOne’s platform without juggling multiple tools. 

Custom OID flexibility

Configure custom SNMP OIDs to track specific performance metrics that matter most to your infrastructure. 

Real-time performance data 

Gain immediate insights into bandwidth usage, uptime, and resource utilization from SNMP monitoring tools. 

Intelligent alerts and automated workflows 

Set alerts and link them to automation policies for hands-off remediation that saves time and reduces risk. 

Granular access and security controls 

Define user permissions to ensure only authorized team members interact with sensitive SNMP monitoring tools. 

legal holds icon

Powerful reporting and analytics 

Generate reports from SNMP network monitoring tools for compliance checks, trend analysis, or capacity planning. 

Driving Performance, Compliance, and Reliability with SNMP Monitoring

Network performance assurance for distributed workforces 

IT teams supporting hybrid environments need reliable visibility across multiple locations. NinjaOne’s SNMP network monitoring tools deliver real-time insights into routers, firewalls, and wireless access points. With proactive alerts, teams resolve issues before they affect employees. Encrypted communication ensures secure monitoring, even across remote branches. This reduces downtime and enhances user experience company-wide. 

Proactive device maintenance for MSPs 

Managed Service Providers rely on SNMP monitoring to keep client infrastructure running smoothly. NinjaOne empowers MSPs to set automated policies that react to SNMP agent events like high CPU usage or dropped connections. These proactive measures reduce costly outages, strengthen client trust, and boost operational efficiency. With flexible reporting, MSPs can also demonstrate value to clients through detailed performance metrics. 

Compliance and security monitoring for regulated industries 

Organizations in healthcare, finance, and government must ensure networks stay compliant with industry regulations. NinjaOne provides secure SNMP monitoring with audit-ready reporting. IT teams can track device uptime, performance, and access logs while maintaining strict security controls. This not only prevents compliance violations but also strengthens the resilience of critical infrastructure. By automating responses, NinjaOne helps regulated industries reduce manual overhead while meeting standards. 

Experience NinjaOne SNMP monitoring today

NinjaOne delivers a smarter way to monitor and manage network devices with SNMP. IT teams benefit from unified dashboards, automation that prevents downtime, and reporting that simplifies compliance. By combining security, scalability, and ease of use, NinjaOne gives IT leaders the visibility they need to support hybrid infrastructures confidently. Start modernizing your network monitoring today with NinjaOne. 

Related Resources

This is why customers love us

Ready to simplify the hardest parts of IT?

SNMP Monitoring FAQs

SNMP monitoring in RMM allows IT teams to track the status and performance of network devices such as routers, switches, and printers. NinjaOne integrates SNMP directly into its remote monitoring and management platform, giving teams a single place to manage endpoints and network infrastructure together. 

Common SNMP commands include GET, SET, and TRAP. GET retrieves information from a device, SET applies a change, and TRAP sends an alert when certain conditions occur. These commands allow NinjaOne to collect metrics and respond to device changes automatically. 

SNMP monitoring in NinjaOne is powered by the NinjaOne NMS agent, which is installed on a designated Windows device within the customer’s network (the network probe). After network discovery, NinjaOne automatically installs the Ninja NMS Manager service on the selected probe. This probe acts as the collector, querying devices for OIDs, receiving SNMP traps, and then securely relaying the results back to the NinjaOne cloud platform. This architecture provides real-time network visibility without requiring direct communication between NinjaOne’s cloud and network devices. 

Most SNMP-enabled devices can be monitored, including routers, switches, and firewalls. However, support varies by vendor, and some devices may have limited metric visibility. NinjaOne recommends verifying specific device compatibility. 

Metrics include uptime, CPU utilization, memory usage, bandwidth throughput, interface errors, and more. NinjaOne can also monitor custom OIDs to capture device-specific data. 

OID, or Object Identifier, is a unique identifier assigned to specific pieces of information on an SNMP device. For example, one OID might track CPU usage while another monitors uptime. 

Yes, NinjaOne allows administrators to configure custom OIDs to track device-specific parameters. However, custom MIBs are not currently supported. The feature helps address some unique infrastructure requirements while working within certain limitations. 

By proactively tracking device performance and alerting IT teams when thresholds are exceeded, NinjaOne helps resolve issues before they impact users. Automation policies can also address problems without manual intervention, reducing downtime risk. 

Absolutely. NinjaOne integrates SNMP monitoring with automation and alerting so that events trigger notifications or remediation workflows. This turns monitoring into an active tool for maintaining uptime. 

SNMP monitoring centralizes visibility across both on-premises and remote devices. NinjaOne’s cloud-based platform makes it easy to monitor distributed infrastructures from a single dashboard, giving IT teams clear oversight of complex environments. 

NinjaOne offers customizable, exportable reports that highlight device performance, uptime, and compliance metrics. Reports can be generated on-demand or scheduled to keep stakeholders informed. 

By securing SNMP traffic with encryption and role-based access, NinjaOne ensures that monitoring data meets compliance standards. Detailed logs and reports provide audit-ready evidence for industries with strict regulations. 

To set up SNMP monitoring in NinjaOne, start by using the Network Discovery feature, which automatically detects SNMP-enabled devices on your network. This modern utility replaces the legacy NMS download and installer, enabling device discovery directly from the NinjaOne console. While the NMS agent is installed separately from the NinjaOne monitoring agent, both can be installed and run in parallel. 

Follow these steps to use Network Discovery effectively: 

  1. Navigate to Network Discovery: In the NinjaOne console, click the “+” icon, then go to Device > NMS Network Discovery
  2. Configure Settings: In the wizard, fill in the required fields: 
    1. Organization: Select the organization to which the devices belong. 
    2. IP Targets: Define the IP range or subnets to scan. 
    3. Credentials: Add SNMP, Windows, or SSH credentials for device access. 
    4. Advanced Settings (optional): Fine-tune ping conditions and other scanning options. 
  3. Run Discovery: Start the scan. Devices are automatically discovered without needing to add them manually. The system also designates the appropriate probe for monitoring. 
  4. Add Devices: On the Review page, check the devices you want to include in your organization. Devices already added cannot be selected again. 
  5. Assign Roles: Assign a device role (e.g., Nms Appliance or Nms Firewall) to determine the NMS policy that will apply. 
  6. Finalize: Click Finish and Confirm to complete the setup.