Key Points
- Start with Health Gates: Run quick prechecks for services, storage, VSS, networking, and configuration to isolate fault class fast.
- Triage by Symptom Class: Map startup/state, install/config, cluster/migration, and device integration issues to targeted probes and logs.
- Fix with Verification: Pair each remediation with an evidence step, such as event IDs, config hashes, or timed boot to ready.
- Prevent Recurrences: Add monitors for the same signals you used to detect and fix the issue and track incident-rate deltas.
- Document Once, Reuse Everywhere: Standardize a runbook template so technicians can consistently capture symptoms, probes, fix, and evidence.
What comes to your mind when you hear the phrase “Hyper-V troubleshooting”? For most, it brings to mind a lot of anxiety, but thankfully, it doesn’t have to be. Most issues fall into a few common categories, such as installation or configuration failures, virtual machines that won’t start or get stuck, cluster and migration problems, storage and network faults, and device integration errors like Enhanced Session Mode.
The key to mastering Hyper-V troubleshooting is learning how to recognize these patterns quickly and apply a structured, repeatable approach. This guide helps you do exactly that. It breaks down the most common incident types, shows you which checks to run first, and explains how to verify that your fix actually worked.
Prerequisites
Before you begin any troubleshooting process, make sure you have:
- Admin access to hosts, clusters, and guest VMs
- Centralized log access for Event Viewer and cluster logs
- PowerShell remoting enabled for hosts and guests
- A staging or sandbox host for verification restores or imports
- A shared location to store incident evidence and runbooks
Method 1: Run health gates before deep diving
Before you start root cause analysis, quickly confirm that the platform’s essential components are operational.
Steps:
- Ensure VMMS, VMWP, and related services are running.
- Run Get-WindowsFeature -Name Hyper-V* and confirm all features show as installed.
- Use vssadminlist writers to confirm all writers are stable and storage volumes are accessible.
- Verify virtual switches and physical NIC bindings using Get-VMSwitch and Get-NetAdapterBinding.
- Inspect recent updates or configuration modifications via Get-WinEvent -LogName System filtered for event IDs tied to Hyper-V role updates.
💡 Check if it works: If all checks return healthy, proceed to the symptom-based flow. Otherwise, correct the failing gate and re-run the checks before escalating.
Method 2: Triage VM startup, stuck state, and access failures
When VMs fail to start or hang in transitional states, check for configuration and metadata corruption, permission issues, missing or locked VHDX files, and storage path problems.
Steps:
- Check for corrupted configuration files or missing .xml or .bin data in C:\ProgramData\Microsoft\Windows\Hyper-V.
💡 Note: Starting with Windows Server 2012 R2, Hyper-V uses binary .VMCX files to store VM configuration and .VMRS files to store the VM’s runtime state, replacing the XML-based format used in earlier versions.)
- Verify permissions on VHDX and configuration files (add NT VIRTUAL MACHINE\Virtual Machines if missing).
- Confirm storage availability for all attached disks using Get-VMHardDiskDrive.
- Check Event Viewer for VMMS and Worker logs: key event IDs include 16010, 18590, and 14098.
- Attempt a manual start using PowerShell: Start-VM -Name <VMName> -Verbose.
💡 Check if it works: Ensure the VM transitions to the Running state and logs event ID 12030 (successful start). Record the start duration and confirm the guest OS boot.
Method 3: Address installation and configuration errors
If Hyper-V role install or configuration changes fail, follow the install/config failure playbook: prerequisites, role services, driver and update alignment, and management tool connectivity.
Steps:
- Check prerequisites with systeminfo (virtualization support and Windows edition).
- Run DISM /online /enable-feature /featurename:Microsoft-Hyper-V-All /All to verify or repair feature installation.
- Review CBS logs for corruption or missing components.
- Validate driver and firmware consistency across hosts.
- Ensure management tools like Hyper-V Manager or PowerShell modules connect correctly.
💡 Check if it works: Reboot and recheck with Get-WindowsFeature -Name Hyper-V*. Confirm Event ID 11707 (successful install) or validate service startup.
Method 4: Resolve cluster connectivity and migration issues
For clustered environments, focus on authentication and group membership, constrained delegation, network path and DNS health, storage presentation, and CSV state.
Steps:
- Run Test-Cluster to validate node connectivity and cluster configuration.
- Check Kerberos delegation for CIFS and Microsoft Virtual System Migration Service.
- Verify DNS health and reverse lookups between nodes.
- Ensure storage presentation consistency and CSV volumes are online.
- Review cluster logs (Get-ClusterLog -UseLocalTime -Destination <path>).
💡 Check if it works: Perform a live migration test and confirm successful completion. Check Event IDs 21502 and 22509 for migration success.
Method 5: Fix device integration and enhanced session mode problems
When input, graphics, USB redirection, or Enhanced Session Mode fail, apply the device-integration troubleshooting flow covering integration services, host and guest policy, and post-upgrade driver alignment.
Steps:
- Confirm integration services are up-to-date using Get-VMIntegrationService.
- Validate group policy under Computer Configuration > Administrative Templates > Windows Components > Remote Desktop Services > Remote Desktop Session Host.
- Reinstall VM Guest Services if corrupted.
- Ensure host and guest display/USB drivers match post-upgrade versions.
💡 Check if it works: Reconnect using Enhanced Session Mode. Log Event ID 20000 (RDP session start) and verify device passthrough behavior.
Method 6: Investigate storage and performance failures
Applicable when VMs experience I/O stalls, slow migration, or frequent VHDX corruption.
Steps:
- Check path availability with Get-Disk and Test-Path.
- Confirm disk attributes aren’t read-only: diskpart > attributes disk clear readonly.
- Review Get-StoragePerformance or performance counters for IOPS and latency trends.
- Evaluate thin-provisioned or dynamic VHDX pressure.
- Convert dynamic disks to fixed if latency persists (Convert-VHD -Path <source> -DestinationPath <target>).
💡 Check if it works: Re-run performance baselines and confirm Event IDs 5120 (CSV online) and 19060 (disk I/O restored).
Method 7: Capture evidence of fix and regression-proofing
Ensure each fix is auditable and repeatable.
Steps:
- Capture key Event IDs, cluster logs, and before/after snapshots of configs or hashes.
- Measure boot-to-ready time post-fix.
- Store evidence in a shared repository.
- Add recurring monitors to the same metrics that indicated the fault.
💡 Check if it works: Confirm alert silence over the next 24 hours and record the incident-rate delta in your service metrics.
Method 8: Build reusable runbooks and knowledge pages
Normalize your incident write-ups into a standard runbook format.
Steps:
- Standardize your runbook format: Symptoms, Probes, Root Cause, Fix, Evidence.
- Add screenshots, PowerShell snippets, and expected Event IDs.
- Store the runbooks in a shared knowledge base.
- Link to vendor references for in-depth background.
💡 Check if it works: Review new technician onboarding time and ensure consistent incident handling across shifts.
Best practices summary table
| Practice | Purpose | Key actions | Value delivered |
| Health gates | Rapid fault-class isolation | Run service, storage, and network checks before deep analysis | Shorter MTTA and fewer false starts |
| Symptom-class playbooks | Ensure consistency across incidents | Map VM, cluster, and config failures to targeted probes | Faster MTTR with less variance |
| Evidence bundles | Create traceable, auditable outcomes | Capture Event IDs, logs, and before/after metrics | Builds confidence and regulatory readiness |
| Storage-first mindset | Prevent hidden I/O and capacity issues | Measure latency, IOPS, and CSV states regularly | Ensures predictable performance under load |
| Runbook standardization | Enable knowledge reuse across teams | Use a unified format, such as symptoms> probes > Fix > Evidence | Faster onboarding and reduced training overhead |
| Cluster hygiene | Maintain reliable node communication | Validate Kerberos, DNS, and CSV health periodically | Reduces failover and migration disruptions |
| Automation and monitoring | Detect and prevent recurring issues | Schedule nightly health-gate scripts and drift detection | Moves from reactive to proactive maintenance |
| Change validation | Confirm each fix with objective proof | Compare config hashes, logs, and timed recovery metrics | Improves service assurance and stakeholder trust |
| Documentation discipline | Turn every fix into a learning asset | Store verified runbooks with context and screenshots | Builds a scalable, searchable troubleshooting library |
Automation touchpoint example
Here’s a simple, beginner-friendly automation example anyone can follow. Think of it as your daily “Hyper-V health checkup.”
- Schedule a daily health gate check: Use Task Scheduler or your RMM tool to run a script each night. The script should check if Hyper-V services are running, confirm storage is available, and verify that VSS writers and cluster volumes are healthy.
- Record results: Save these results to a shared folder with a date in the file name (for example, HyperV_Health_2025-11-12.txt).
- Add alerts: If any service is stopped or a VSS writer shows an error, send an email or create a ticket so the team can respond immediately.
- Collect logs on demand: During an incident, run a simple PowerShell script that gathers recent logs and events and saves them into an “Evidence” folder for that day.
- Verify and close: Once the issue is fixed, rerun the health gate check. If everything passes, zip the evidence folder and attach it to your ticket as proof of resolution.
How NinjaOne can help
NinjaOne can help you automate nearly all the steps in this playbook without needing to jump between different tools. Here’s how you can use it effectively:
- Create automated alerts: Configure alerts in NinjaOne to trigger when the scripts detect failures, like a stopped service, failed disk, or migration issue. These alerts can automatically generate tickets or notifications in your PSA tool.
- Simplify incident response: Set up one-click remediation scripts in NinjaOne for common Hyper-V fixes, such as restarting services, clearing VSS states, or refreshing a cluster node. These can be run manually or automatically depending on severity.
- Track and verify fixes: Attach output logs or screenshots directly to the NinjaOne ticket so your team can verify the issue was resolved. You can also add a post-fix validation script that re-runs the health gates automatically and updates the ticket with results.
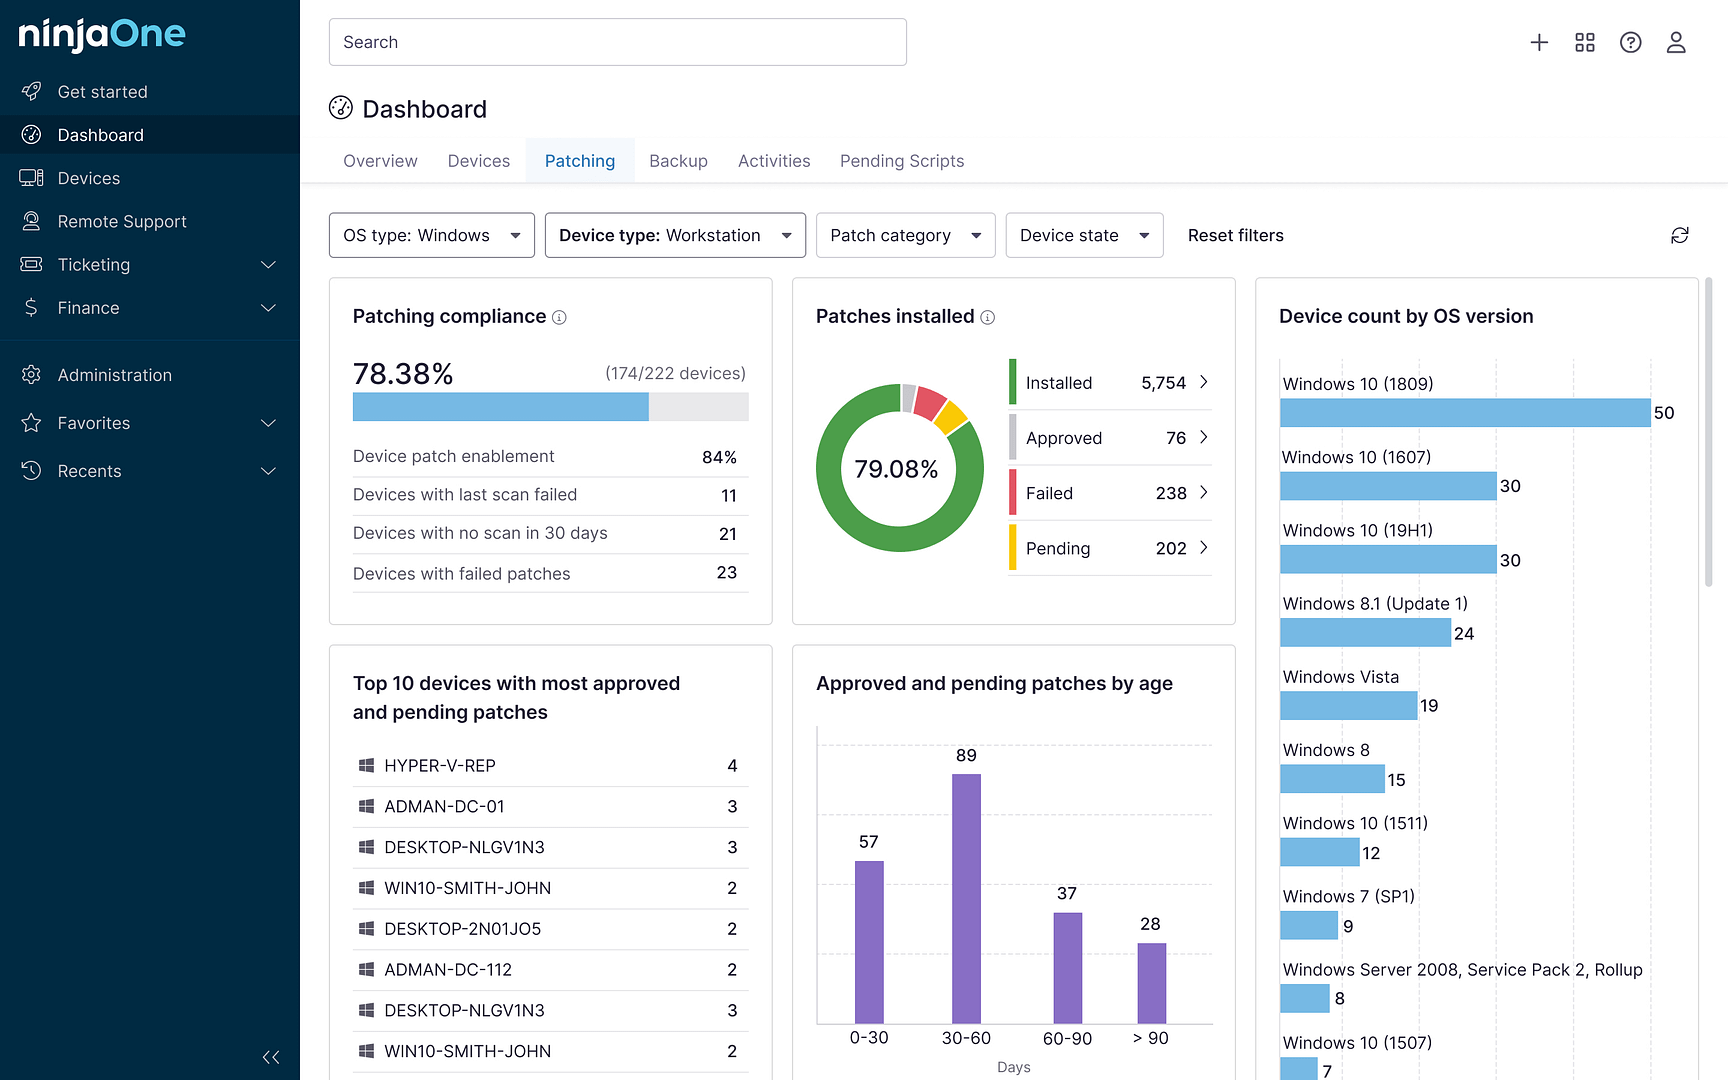
- Build custom dashboards: Create a simple NinjaOne dashboard to display Hyper-V health summaries, top alerts, and cluster states. This gives you a quick visual cue for system health across all environments.
- Scale across clients: For MSPs, clone the same policies and scripts across tenants with minimal modification. Use variables in your scripts for things like cluster names or log paths to make them portable.
Troubleshooting Hyper-V incidents
Most Hyper-V incidents are solvable quickly when you classify the problem first, follow symptom-specific flows, and prove recovery with evidence. Health gates, focused probes, and standardized runbooks turn firefighting into a consistent, auditable practice that scales across tenants.
Related topics:
- 10 Best Hyper-V Management Tools
- Optimize Your IT Management: Mastering Hyper-V Replication Monitoring with PowerShell
- Comprehensive Guide to Monitoring Hyper-V Shared Disk Space with PowerShell
- How to See if Your Hyper-V Virtual Machine is Generation 1 or Generation 2
- How to Install and Enable Hyper-V on Windows 10 for Hardware Virtualization


