Key Points
- Map technical KPIs directly to what users experience, not just what dashboards report
- Capture normal CPU, memory, network, and response time data across a full business-day cycle to separate genuine regressions from expected variance
- Address startup bloat, unpatched software, storage performance issues, and browser extension sprawl to improve app responsiveness
- Apply Quality of Service (QoS) policies, split-tunnel VPN alignment, and bandwidth monitoring to avoid confusing network congestion as application-level bugs
- Analyze trends, centralize detection, document optimizations, and tie alerts to baseline deviations to keep improvements continuous
Application performance optimization is key to keeping your products competitive in today’s market. Consumers need fast and responsive apps to stay happy, and it’s your job to keep the software smooth and efficient. But you’ll need a structured framework that goes beyond app monitoring and latency trends.
Assess your entire infrastructure for app improvement opportunities. This article explains how to streamline apps using unified management platforms.
App optimization requires a structured diagnosis
Setting goals and optimizing application, network, and data-related components creates a cross-layer approach that can improve application response times and overall performance.
Define performance in terms of user impact
Your apps need to be fast, usable, and responsive. But the criteria you use to measure these should always account for what users actually experience to produce genuine improvements.
Doing so also aligns IT and non-IT stakeholders. According to the International Journal of Mobile Computing and Application, apps that had crash rates higher than 1% saw significantly less use during a 30-day study, proving that app optimization is both a technical and a business concern.
For meaningful application performance optimization, focus your efforts on:
- Application launch time: Your app’s startup time.
- Transaction completion time: The time it takes to achieve a meaningful action (e.g., check out your shopping cart, submit a form, etc.)
- Error rate frequency: The average rate of your application failing or returning an error.
- Resource use thresholds: How much CPU, memory, and network bandwidth your app can use.
- User-reported issues: Your app’s subjective perception of slowness (e.g., your app loads in 1.2 seconds, but feels slower compared to App B’s 0.4 seconds).
Strengthen monitoring and baseline visibility
How your app behaves under normal, expected conditions creates the baseline against which all further testing is measured. This helps IT pros determine if a legitimate slowdown is caused by network issues, bad code, misconfigured alerts, or something else entirely.
Establish normal performance benchmarks
Capture a representative “cross-section” of regular traffic (e.g., 24-hour cycle on a business day) to track performance fluctuations during peak hours via:
- Response time percentiles (P50, P90, P95)
- Throughput measured in requests per second
- Error rates
- Resource utilization levels
Track CPU, memory, and disk utilization on endpoints
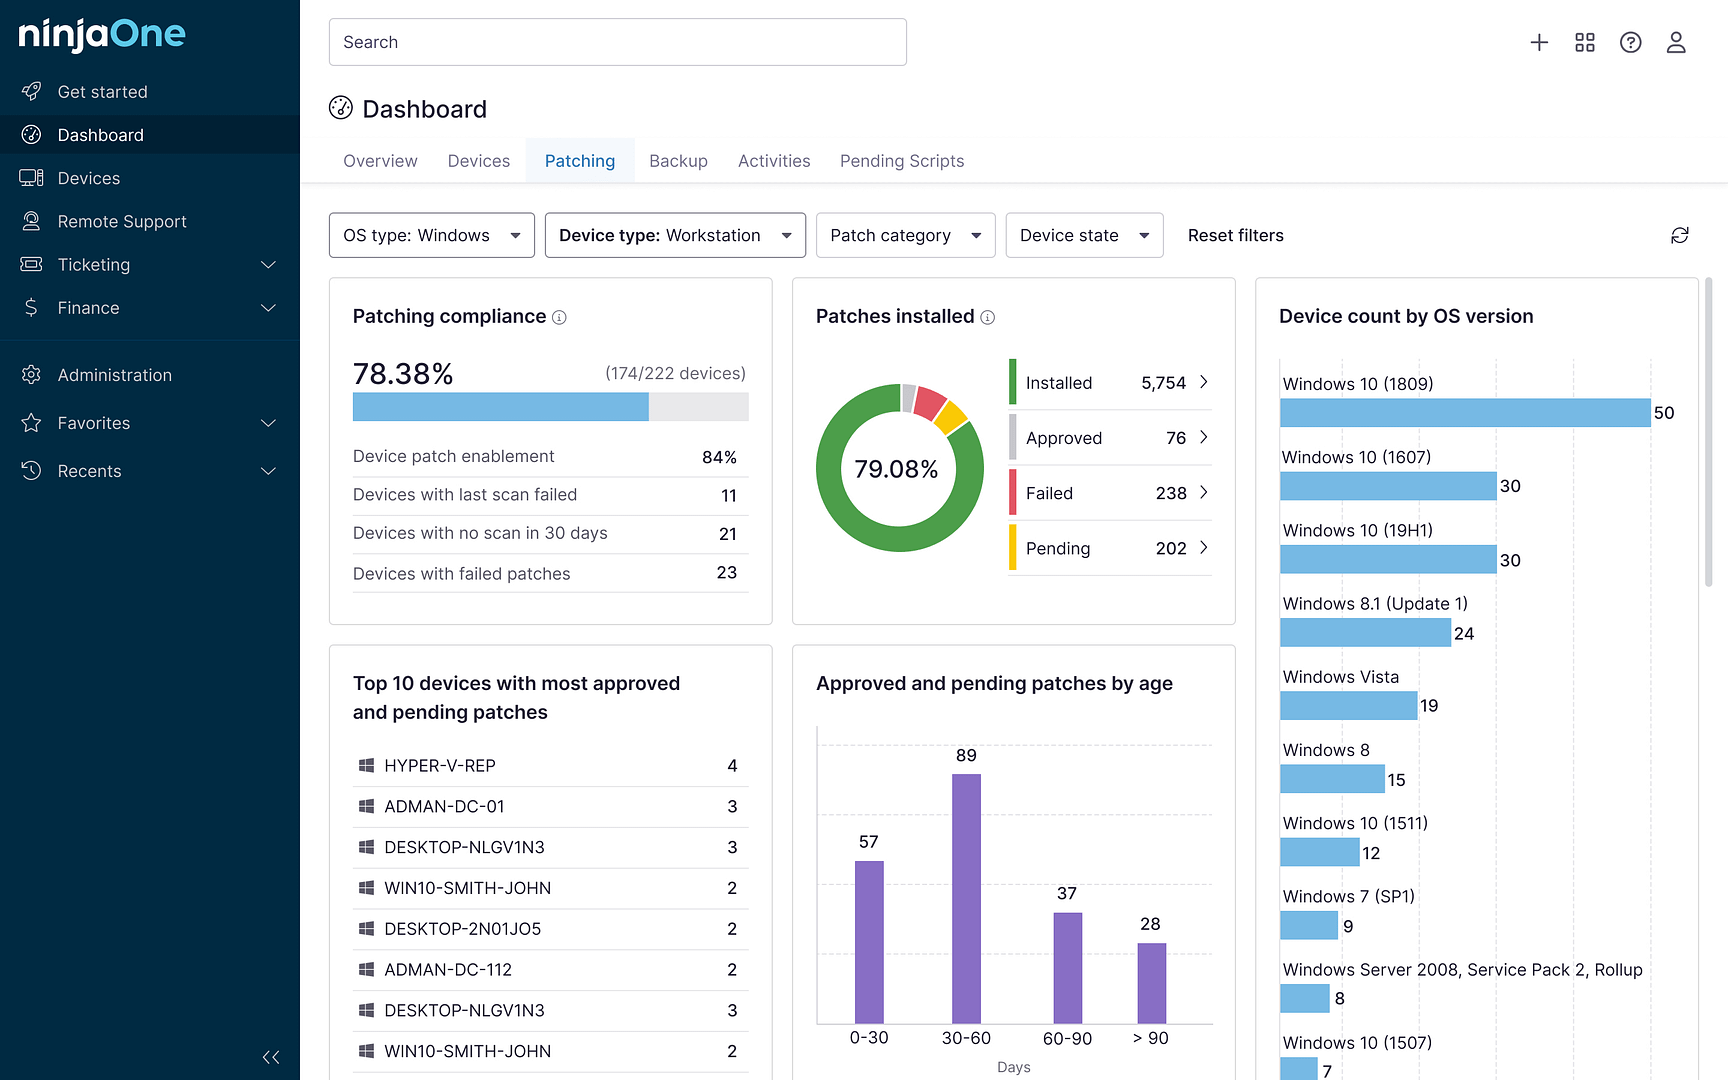
Measuring your application’s resource consumption requires visibility into your endpoint devices and the resources they use across the enterprise. A centralized Remote Monitoring Manager (RMM) like NinjaOne can simplify the process while providing IT professionals with centralized monitoring and management capabilities.
Monitor network latency and packet loss
Network degradation is often mistaken for application bugs, so establish a normal latency range to ensure that more accurate alerts are generated. To rule out any false positives, factor in:
- Round-trip latency
- Jitter (packet delay variation)
- Packet loss
- Bandwidth utilization per network segment
Identify peak usage patterns
Capacity planning teams need to anticipate server loads. Tracking daily or weekly peaks, traffic spikes related to product launches, seasonal demand patterns, and geographic usage trends helps establish a usage baseline, providing context for performance analysis after flash sales or outages.
Correlate performance events with user activity
Closing the gap between infrastructure telemetry and user impact is key. Detecting a CPU spike is easy—correlating app traces, server metrics, network health, and real user monitoring to pinpoint affected processes and users is a must for cross-layer application performance optimization.
Optimize endpoint resource management
Endpoint health significantly impacts app performance. Even a fully optimized application can stagger on a device with outdated patches and memory leaks. Here’s how to streamline resource use for improved app performance.
| Method | Steps |
| Reducing unnecessary startup applications |
|
| Controlling background process execution |
|
| Ensuring timely application and OS updates | Automate update deployment using platforms like NinjaOne or Intune to improve patch compliance, maintain stability, and reduce operational disruption. |
| Monitoring disk health and storage performance | Monitor disk health and perform storage maintenance activities where appropriate to reduce performance bottlenecks. |
| Managing browser extension sprawl |
|
Address network performance constraints
Network performance can influence application responsiveness. Quality of Service (QoS) mechanisms (e.g., Low-Latency Queuing) and properly configured split-tunnel Virtual Private Networks (VPNs) can help prioritize critical traffic, manage bandwidth utilization, and reduce latency for essential services.
To streamline networks for app performance, track these scalable metrics:
- Bandwidth utilization
- Connection latency
- Session counts
- Network device CPU and memory utilization
- Network error rates
Enhance mobile application performance management
Slow, clunky apps lose users fast. That’s why optimizing application performance and using staged rollouts for important updates are important for both customer satisfaction and business objectives.
Regularly monitor your application’s load times, error rates across different device types, and crash reports to catch issues early. Then use behavioral analytics and staged rollouts to improve the user experience.
Implement structured root cause workflows
It’s critical for IT pros to spot larger issues affecting app performance. Battery deterioration or connectivity variables could be causing your app to stall or crash at certain times.
To know for sure, build a framework to identify, review, analyze, map, and document incidents for improved data collection and detection.
🥷🏻| Monitor your client’s device health through an IT platform that optimizes visibility.
Measure improvement and prevent regression
Application performance optimization is an ongoing process, so it’s key that your wins are celebrated and tracked. Analyzing trends, tying alerts to thresholds, and regularly tracking performance help maintain momentum. But documenting methods that work and syncing efforts with major vendor updates is key to success.
Application performance optimization is a multi-layer effort
Improving application performance requires coordination across network, endpoint, and structural aspects of your infrastructure. To deliver measurable performance improvements, define user impact metrics, create performance baselines, and enforce disciplined workflows.
Related topics: