Key Points
- Use PowerShell in Microsoft 365 to generate Exchange Online message traces for delivery status, delays, and failures.
- Run Get-MessageTraceV2 for live traces within the last 10 days and use Get-MessageTraceDetailV2 for hop-level delivery diagnostics.
- Execute Start-HistoricalSearch for long-range or large-scale data collection to create audit-ready CSV exports covering up to 90 days of message activity.
- Normalize and enrich trace data with calculated fields (e.g., TimeSpanMinutes, DeliveryOutcome) to simplify analysis and compliance checks.
- Automate message tracing using secure app-only authentication, scheduled PowerShell jobs, and robust error-handling for noninteractive execution.
- Store and document trace outputs systematically to support audits, investigations, and continuous email governance visibility.
The Microsoft 365 message trace tool enables managed service providers (MSPs) and IT administrators to accurately and repeatedly investigate and monitor email delivery across Exchange Online. When combined with PowerShell automation and various cmdlets, tracing allows teams to quickly answer delivery questions, generate audit-ready reports, and scale their investigations across tenants. Keep reading for a structured workflow that ensures operational visibility and compliance readiness.
How to use PowerShell to generate Microsoft 365 message tracing reports
Message tracing in Microsoft 365 can explain how an email moved through Exchange Online and why it was delivered, deferred, or failed. This makes it an essential tool for mail flow visibility and governance. PowerShell provides several flexible methods for generating these reports, allowing administrators to capture both recent and historical data with precision. Below are steps that outline the cmdlets you can use, how to shape and enrich results, and how to utilize reports through various phases effectively.
📌 Prerequisites:
- Exchange Online PowerShell module on an admin workstation
- Rights to run message trace and historical search in the tenant
- Secure credential storage and an output directory for exports
- Optional Azure app registration for app-only automation
Phase 1: Collect data
The first step is to gather data for all message trace analysis using PowerShell cmdlets. You have two options, depending on your time range and reporting needs.
Option 1: Run live traces for recent messages
You can use a live trace to quickly check what happened to a message from a recent timeframe (only within the past 10 days) in Microsoft 365. It allows you to determine whether a message was successfully delivered, delayed, or failed, and see the exact path it took through Exchange Online without requiring large exports.
- On a managed workstation, connect to Exchange Online by establishing a secure session using an admin account with message-tracing rights, and make sure you’re connected to the correct tenant before running any traces.
- Use
Get-MessageTraceV2with time-bounded filters. Define a recent time window and apply precise filters (e.g., sender, recipient, subject keyword, or status) to return only relevant results. - For any message that requires further investigation, retrieve hop details (e.g., transport rules applied, connector hops, anti-spam/anti-malware verdicts, and delays) that explain the delivery outcome using
Get-MessageTraceDetailV2.
💡 Note: Microsoft deprecated Get-MessageTrace and Get-MessageTraceDetail cmdlets, and updated them to Get-MessageTraceV2 and Get-MessageTraceDetailV2, respectively.
- Save outputs to CSV (and optionally JSON) and include the tenant identifier, start/end times, and filter parameters in the filename or metadata.
Option 2: Use historical search for longer ranges
If you need to analyze mail flow beyond the live trace window or gather large datasets for audits, you can use historical search. This queries Microsoft’s backend to generate more comprehensive CSV reports for more extended periods (up to 90 days), ideal for compliance reviews and monthly governance reporting.
- Use
Start-HistoricalSearchto request a report for a defined date range (e.g., several days to weeks) and initiate an asynchronous job handled by Microsoft 365. - Ensure that you monitor the search status until the CSV is ready, then download the data and store it with metadata, including the start time, date range, requester, and report title, for audit consistency.
- Schedule automated weekly or monthly historical searches for compliance reporting.
Phase 2: Choose the right surface for review and validation
It’s also important to choose the right interface for reviewing Microsoft message trace results to ensure efficiency and accuracy. PowerShell provides automation and more control, while the Microsoft 365 portals offer quick and manual visual access.
- Use the Microsoft Defender portal and Exchange admin center when you need to:
- Verify specific messages
- Confirm PowerShell results
- See delivery status
- Filter actions
- Check timeline details without running commands.
- Use PowerShell as the authoritative method for exporting, filtering, and logging traces. It ensures:
- Consistency across investigations
- Repeatable automation for governance
- Complete data for compliance documentation
Phase 3: Export, normalize, and enrich
Next, prepare the message trace data for analysis and compliance. Raw outputs from PowerShell are useful, but you want to normalize and enrich them to make reports easier to interpret and defend during audits.
- Save trace results in CSV format for easy review, sorting, and sharing within operations teams. You can also use JSON exports to provide flexible input for dashboards, data pipelines, or SIEM systems.
- Enhance data usefulness by deriving new fields (e.g.,
TimeSpanMinutesandDeliveryOutcome) to quickly spot trends and performance issues. - Always document which parameters and filters were applied, which script version generated the report, and how many records were returned, for a more transparent audit trail for later validation and reproduction.
Phase 4: Automate with secure authentication
When collecting evidence across many tenants, automating message tracing will help ensure consistency and auditability. Focus on secure, non-interactive authentication, resilient execution, and clear run logging to ensure results are trustworthy and repeatable.
- For non-interactive jobs, use certificate-based app-only authentication to avoid stored user passwords and MFA prompts, and assign only the minimal Exchange roles required.
- Rotate certificates, restrict private key access, and monitor expiry to keep schedules running securely.
- Implement retry logic for known transient conditions (e.g., network hiccups, service throttling) to prevent long-running tasks from failing due to a single blip. Include graceful skip/continue behavior and clear error messages to facilitate post-mortem analysis.
- Schedule daily live traces for quick insight and weekly historical searches for broader coverage, then log start/end times, time zone, parameters, item counts, and failures to a central location. Use consistent filenames and alert on anomalies (e.g., zero results, high failure rates) to proactively identify and address issues.
Phase 5: Operationalize for investigations and audits
Lastly, you must operationalize message tracing to make individual runs useful for investigations, audits, and governance. Standardize how results are stored, referenced, and correlated to build a defensible record of mail flow controls and incident response actions.
- Attach message trace exports directly to incident tickets, case timelines, or documentation systems to create a clear chain of evidence showing when messages were sent, what path they took, and why delivery outcomes occurred.
- Maintain representative trace samples each month to verify that security, filtering, and routing controls are functioning as expected. These archived samples also provide measurable proof of ongoing operational health and policy enforcement.
- Compare message trace anomalies against changes in admin roles, user licensing, or mailbox rules to detect configuration drift, privilege misuse, or policy exceptions that could explain unusual mail flow behavior or compliance gaps.
Best practices summary table
Below is a table of best practices that ensure Microsoft 365 message tracing remains accurate and secure for auditing purposes.
| Practice | Purpose | Value delivered |
| V2 live trace cmdlets | Current interface for recent mail | Faster answers with consistent output |
| Historical search | Large and older datasets | Complete coverage without timeouts |
| App-only automation | Secure, noninteractive schedules | Reliable and compliant unattended runs |
| Normalized exports | Standardized and structured reporting | Easier data joins and dashboard integration |
| Audit-friendly evidence | Logged runs and record counts | Traceability for investigations and reviews |
Why generate message tracing reports using PowerShell in Microsoft 365
Generating Microsoft 365 message tracing reports using PowerShell offers a faster and repeatable method for analyzing mail flow across tenants. Unlike the graphical interface in the Exchange admin center, PowerShell offers automation and more precise filtering, which is ideal for investigations and ongoing compliance reports. Key benefits include the ability to:
- Schedule traces and exports without manual intervention.
- Handle large datasets and long date ranges efficiently.
- Apply exact filters for sender, recipient, or status.
- Log parameters, timestamps, and results for traceability.
- Feed reports into monitoring tools or governance dashboards.
Automation touchpoint example
MSPs can utilize automation to integrate massage tracing into daily operations. This ensures consistent evidence collection and timely insights without manual effort. Here’s a sample workflow for a scheduled PowerShell job that streamlines tracing, reporting, and documentation:
- Daily live trace job: Runs
Get-MessageTraceV2every 24 hours to capture recent delivery activity. - Detail enrichment: Uses
Get-MessageTraceDetailV2to append hop-by-hop data for each message. - Structured export: Writes results to a CSV file labeled with timestamps and tenant identifiers for easy tracking.
- Weekly historical export: Executes
Start-HistoricalSearchonce a week to generate a 10-day dataset for broader analysis. - Run logging: Records start and end times, item counts, duration, and filter parameters for audit purposes.
- Automated reporting: Posts a concise summary of results to the documentation or monitoring workspace for quick visibility.
NinjaOne integration
NinjaOne can be integrated into Microsoft 365 message tracing to help MSPs automate various tasks within their management platform. This can help simplify compliance workflows and strengthen visibility.
| Integration task | Purpose | Value delivered |
| Deploy and schedule scripts | Automate PowerShell message trace jobs from the NinjaOne console | Ensures consistent, unattended report generation across clients |
| Store credentials securely | Keep admin or app credentials encrypted within NinjaOne’s credential store | Protects sensitive access details and supports compliance |
| Attach exports and logs | Upload CSVs and run logs to client documentation | Centralizes evidence for investigations and audits |
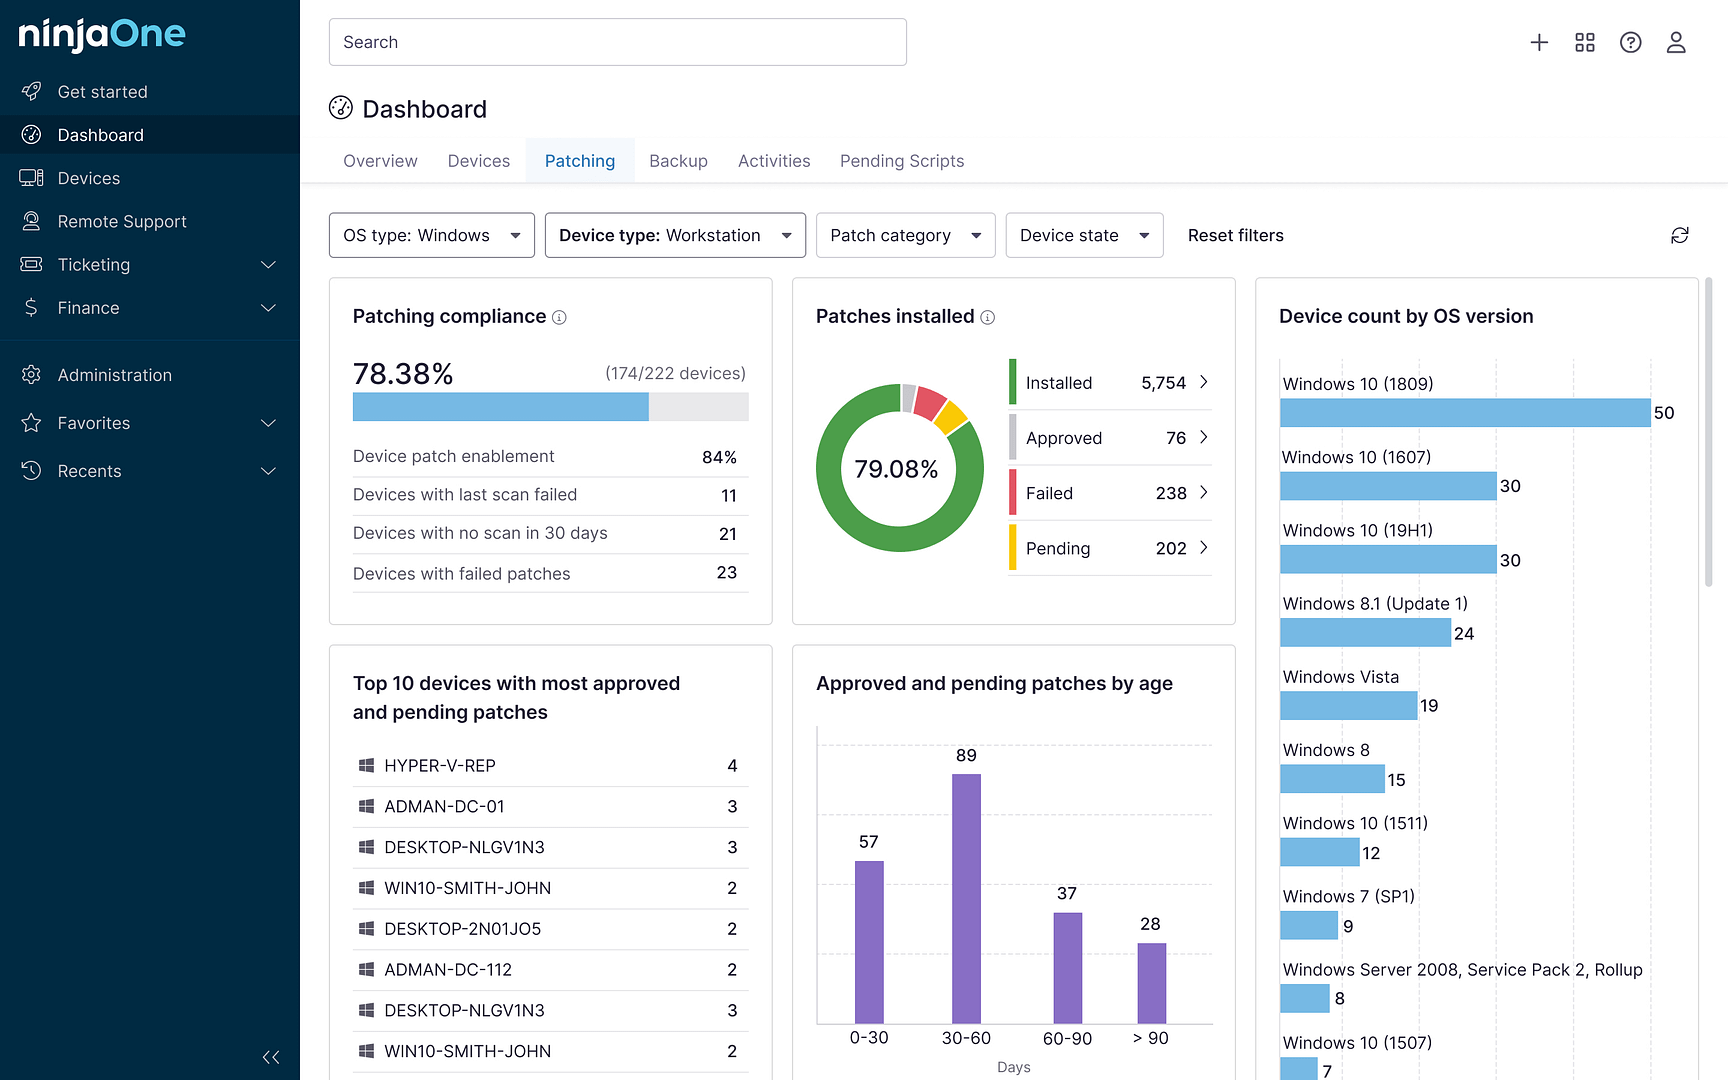
| Summarize key metrics | Display daily totals and notable message statuses in dashboards or reports | Provides quick operational insight and supports QBR discussions |
Ensuring reliable compliance with PowerShell-driven message tracing
Administrators and MSPs can achieve speed and precision in email delivery investigations by generating Microsoft 365 message tracing reports using PowerShell. It enables precise control, automation, and more consistent reporting for easier issue investigation, compliance maintenance, and delivery of health documentation. Pairing automation with the steps outlined in this article, you can ensure every trace run contributes to transparency and accountability.
Related topics:


