Microsoft Defender for Endpoint has powerful, real-time security alerting. However, IT technicians can overlook these alerts if they aren’t escalated into the MSP’s PSA system. Automating alert escalation and ticket creation bridges the gap between detection and response. Automating also ensures technicians can act on threats immediately.
Ways to automate alert escalation from Defender to PSA systems
You can automate alert escalation from Defender to PSA systems by retrieving Defender alerts, formatting the alert payload, triggering a webhook, scheduling alert polling, adding an audit trail, or using Group Policy to improve logging and alert context.
📌 Prerequisites:
- Microsoft 365 Defender Plan 2 or Microsoft 365 E5
- API access to your PSA system
- Microsoft Graph permissions: SecurityEvents.Read.All, Incident.Read.All, Alert.Read.All
- Azure AD app registration for automation authentication
- Admin access to NinjaOne, RMM, or scripting engine
- PowerShell 7+ and Graph SDK module
📌 Recommended deployment strategies:
Method 1: Connect to Microsoft Graph and retrieve Defender alerts
📌 Use Case: IT teams looking to retrieve live Defender alerts
Part 1: Register your app in Entra ID (Azure AD)
- Sign in to the Microsoft Entra admin center.
- Browse to Entra ID > App registrations, then click New registration.
- Enter a Name for your app.
- Specify who can use the application under Supported account types.
- Press Register to complete the registration.
- Record the Application (client) ID shown in the application’s Overview page.
Part 2: Assign Microsoft Graph API permissions
- Go to App registration > Select the application you created >API permissions.
- Click Add a permission > Microsoft Graph
- Choose:
- Delegated permissions: If a signed-in user is involved
- Application permissions: If your app runs in the background
Part 3: Generate and store a client secret
- Select App registration > Select the application you created >Certificates & secrets.
- Click New client secret.
- Add a description and expiration, then press Add.
- Copy the value immediately since it’s only shown once.
Part 4: Note the client ID, tenant ID, and client secret
| Values | Where to find |
| Client ID | App Registration → Select the application you created → Overview |
| Tenant ID | App Registration → Overview |
| Client Secret | App Registration → Select the application you created → Certificates & secrets |
Part 5: Connecting to Microsoft Graph and retrieving Defender alerts
- Press Win, type PowerShell, then click Run as administrator.
- Copy and paste the following script into the prompt, then press Enter:
- PowerShell connection script:
| $clientId = “YOUR-APP-CLIENT-ID” $tenantId = “YOUR-TENANT-ID” $clientSecret = “YOUR-CLIENT-SECRET” $secureSecret = ConvertTo-SecureString $clientSecret -AsPlainText -Force $credential = New-Object System.Management.Automation.PSCredential($clientId, $secureSecret) Connect-MgGraph -TenantId $tenantId -ClientSecretCredential $credential |
- Retrieve alerts:
| Alert type | Script |
| Import only the Security submodule | Import-Module Microsoft.Graph.Security |
| Connect (replace with your app or interactive login) | Connect-MgGraph |
| Switch to beta profile for richer alert data | Select-MgProfile -Name beta |
| Get new alerts | Get-MgSecurityAlert | Where-Object { $_.Status -eq “newAlert” } |
💡 Note: The cmdlet Select-MgProfile -Name beta was deprecated starting with Microsoft Graph PowerShell v2.0. For newer versions, users should install and use the Microsoft.Graph.Beta module instead
⚠️ Warning: Before deploying the settings change on different endpoints, it’s best to test it out on a local machine first. (For more info, refer to: Things to look out for)
Method 2: Format alert payload for PSA ticket creation
📌 Use Cases: IT admins who want to prepare alert details for quick submission to the helpdesk system
To prepare ticket content from Microsoft Defender alerts and format it into a JSON payload for submission to a PSA system via webhook.
Step 1: Format the ticket title
- Construct a title using severity and title:
- “[$($_.Severity)] $($_.Title)”
- Example:
- [High] Ransomware activity detected
Step 2: Compose the ticket body
- Ensure you include relevant details when creating the ticket body:
- Defender Alert: $alert.Description
- Device: $alert.DeviceName
- User: $alert.UserPrincipalName
- Detected At: $alert.CreatedDateTime
- Alert ID: $alert.Id
- Example:
- Defender Alert: File encryption behavior detected on device LAPTOP-1234.
- Device: LAPTOP-1234
- User: [email protected]
- Detected At: 2025-07-01T14:00:00Z
- Alert ID: 3d7f2ae1-xxxx-yyyy-zzzz-abc123
💡 Note: Field names may vary across environments and Microsoft Graph versions.
Step 3: Map category to PSA issue type
Afterward, you must match the alert category to a PSA issue type. Use the following as a reference:
| Defender category | PSA issue type |
| Malware | Security Incident |
| Credential Theft | Identity Threat |
| Suspicious Activity | Behavioral Analysis |
| Phishing | Email Security |
| Unwanted Software | Potentially Unwanted |
| Other | General Alert |
💡 Note: Exact mappings may differ by PSA system.
Step 4: Construct the JSON payload
Using the examples above, the JSON payload should look like this:
| { “summary”: “[High] Ransomware activity detected”, “description”: “Defender Alert: File encryption behavior detected on device LAPTOP-1234.\n\nDevice: LAPTOP-1234\nUser: [email protected]\nDetected At: 2025-07-01T14:00:00Z\nAlert ID: 3d7f2ae1-xxxx-yyyy-zzzz-abc123”, “priority”: “High”, “endpoint”: “LAPTOP-1234”, “detectedAt”: “2025-07-01T14:00:00Z” } |
Method 3: Trigger webhook or API call to PSA system
📌 Use Case: Send Defender alerts directly into the PSA ticket queue
- Press Win + R, type PowerShell, then click Run as administrator.
- Copy and paste the following script into the prompt, then press Enter to send a ticket using PowerShell and a webhook:
Invoke-RestMethod -Method Post -Uri $psaWebhookUrl -Body
($alertJson | ConvertTo-Json -Depth 5) -ContentType “application/json”
💡 Note: $psaWebhookUrl and $alertJson are placeholders and should be replaced with your actual PSA webhook endpoint and a properly formatted JSON payload.
For systems with token-based API access:
- Authenticate via REST token
- Use HTTP POST to /tickets endpoint
- Confirm response status 200/201 and ticket ID return
💡 Tip: Log ticket creation locally or in event logs for traceability.
Method 4: Schedule alert polling with PowerShell or Azure automation
📌 Use Case: Run script every 5 to 15 minutes to catch and escalate alerts automatically
- Press Win + R, type PowerShell, then click Run as administrator.
- Copy and paste the following script into the prompt, then press Enter to detect and escalate new alerts every 5 to 15 minutes:
| $alerts = Get-MgSecurityAlert | Where-Object { $_.Status -eq “newAlert” -and $_.CreatedDateTime -gt (Get-Date).AddMinutes(-15)} |
You can run this via:
- Azure Automation with managed identity
- Windows Task Scheduler on RMM-controlled endpoint
- NinjaOne scripting policy
💡 Note: Before running this script, you must first connect using Connect-MgGraph and ensure the app has the right permissions.
Method 5: Add a registry-based audit trail to escalated endpoints
📌 Use Case: Record the time of the last alert escalation for endpoint audit checks
- Log to the registry on the affected device during ticket creation.
- Press Win + R, type PowerShell, then click Run as administrator.
- Copy and paste the following script into the prompt, then press Enter:
| New-ItemProperty -Path “HKLM:\SOFTWARE\Org\DefenderEscalation” -Name “LastAlertEscalated” -Value “$(Get-Date -Format u)” -PropertyType String -Force |
This lets RMM agents scan and validate alert handling at the device level.
⚠️ Warning: Writing to the registry could conflict with existing keys or policies. (For more info, refer to: Things to look out for)
Method 6: Use Group Policy to improve logging and alert context
📌 Use Case: Future alerts contain more context to make it easier to investigate
- Press Win + R, type gpmc.msc, then press Enter to open the Local Group Policy Editor.
- Navigate to:
Computer Configuration > Administrative Templates > Windows Components > Microsoft Defender Antivirus > Reporting
- Enable the following:
- Send alert information to Microsoft Defender for Endpoint
- Monitor and log detected threats
Apply audit policies
- Navigate to:
Computer Configuration > Windows Settings > Security Settings > Advanced Audit Policy Configuration > System Audit Policies> Object Access
- Enable the following to enrich alert telemetry:
- Audit File System (Logging for file deletion).
- Audit Registry (Registry changes).
- Then, navigate to:
Computer Configuration > Windows Settings > Security Settings > Advanced Audit Policy Configuration > System Audit Policies > Detailed Tracking > Audit Process Creation
- Enable Process execution
⚠️ Warning: Enabling detailed audit policies increases log size. (For more info, refer to: Things to look out for)
⚠️ Things to look out for
| Risks | Potential Consequences | Reversals |
| Not testing on a local machine | Deploying an untested script may cause devices to crash due to issues such as registry key incompatibility. | Apply the changes you want on a local machine, and then verify if the configuration reflects the intended results. |
| Conflicting keys | Some keys and policies may fail if they conflict with each other.. | Use a dedicated registry path to prevent conflicts. |
| Increased log size | Consumes disk space quickly | Configure log retention and size limits in Event Viewer. |
Additional considerations
The following practices ensure your PSA handles security alerts with precision across multi-tenant environments.
De-duplication
Prevent duplicate tickets by checking the alert ID in a cache or database before creating a new one. This helps stop ticket floods from repeated alerts.
Alert lifecycle
Keep PSA tickets in sync with Defender alerts so ticket status always matches the real-time alert state.. This improves incident traceability and reduces ticket clutter.
Multi-tenant awareness
Include context, such as tenant ID or client name, to ensure tickets are associated with the correct client, tenant, or site in multi-tenant environments.
Data retention
Preserve alert-to-ticket mapping to maintain maps between Defender alert IDs and PSA ticket IDs for compliance, auditing, or incident review. Data retention also enables deeper analytics on threat patterns and PSA responsiveness.
Troubleshooting common alert escalation issues
Below are common issues in Defender-to-PSA integrations, along with their solutions.
Graph API fails
If you can’t retrieve alerts from Defender or encounter similar errors, the likely culprits are expired tokens or an incorrect API endpoint. Ensure you use the correct endpoint format to resolve the issues.
Webhook timeouts
There are cases when the Defender alert is triggered, but a ticket doesn’t appear in the PSA because the PSA platform is inaccessible from Microsoft’s cloud. When this happens, it’s best to validate the webhook URL accessibility.
Duplicate tickets
Duplicate PSA tickets can occur when the alert or incident ID isn’t tracked after the first ticket creation. Always check if the alert has escalated before creating a new ticket to avoid duplication.
Ticket not visible
Some tickets are hard to locate or appear under a different queue because they were created on the wrong board, queue, or service desk. In this case, the best course of action is to confirm that the required fields are included and correctly mapped.
NinjaOne services that strengthen alert escalation automation
MSPs can streamline threat-to-ticket workflows, reduce response time, and provide audit-ready traceability across their client base by using NinjaOne. Some services that strengthen alert escalation automation include:
- Script scheduling and delivery: Run Microsoft Graph query and ticket escalation scripts across client tenants.
- Webhook triggers: Integrate directly with ticketing or Slack channels for alert forwarding.
- Registry monitoring: Track device-level escalation tags via custom registry scans.
- Alert policy control: Use NinjaOne to determine which alerts require escalation, suppression, or remediation.
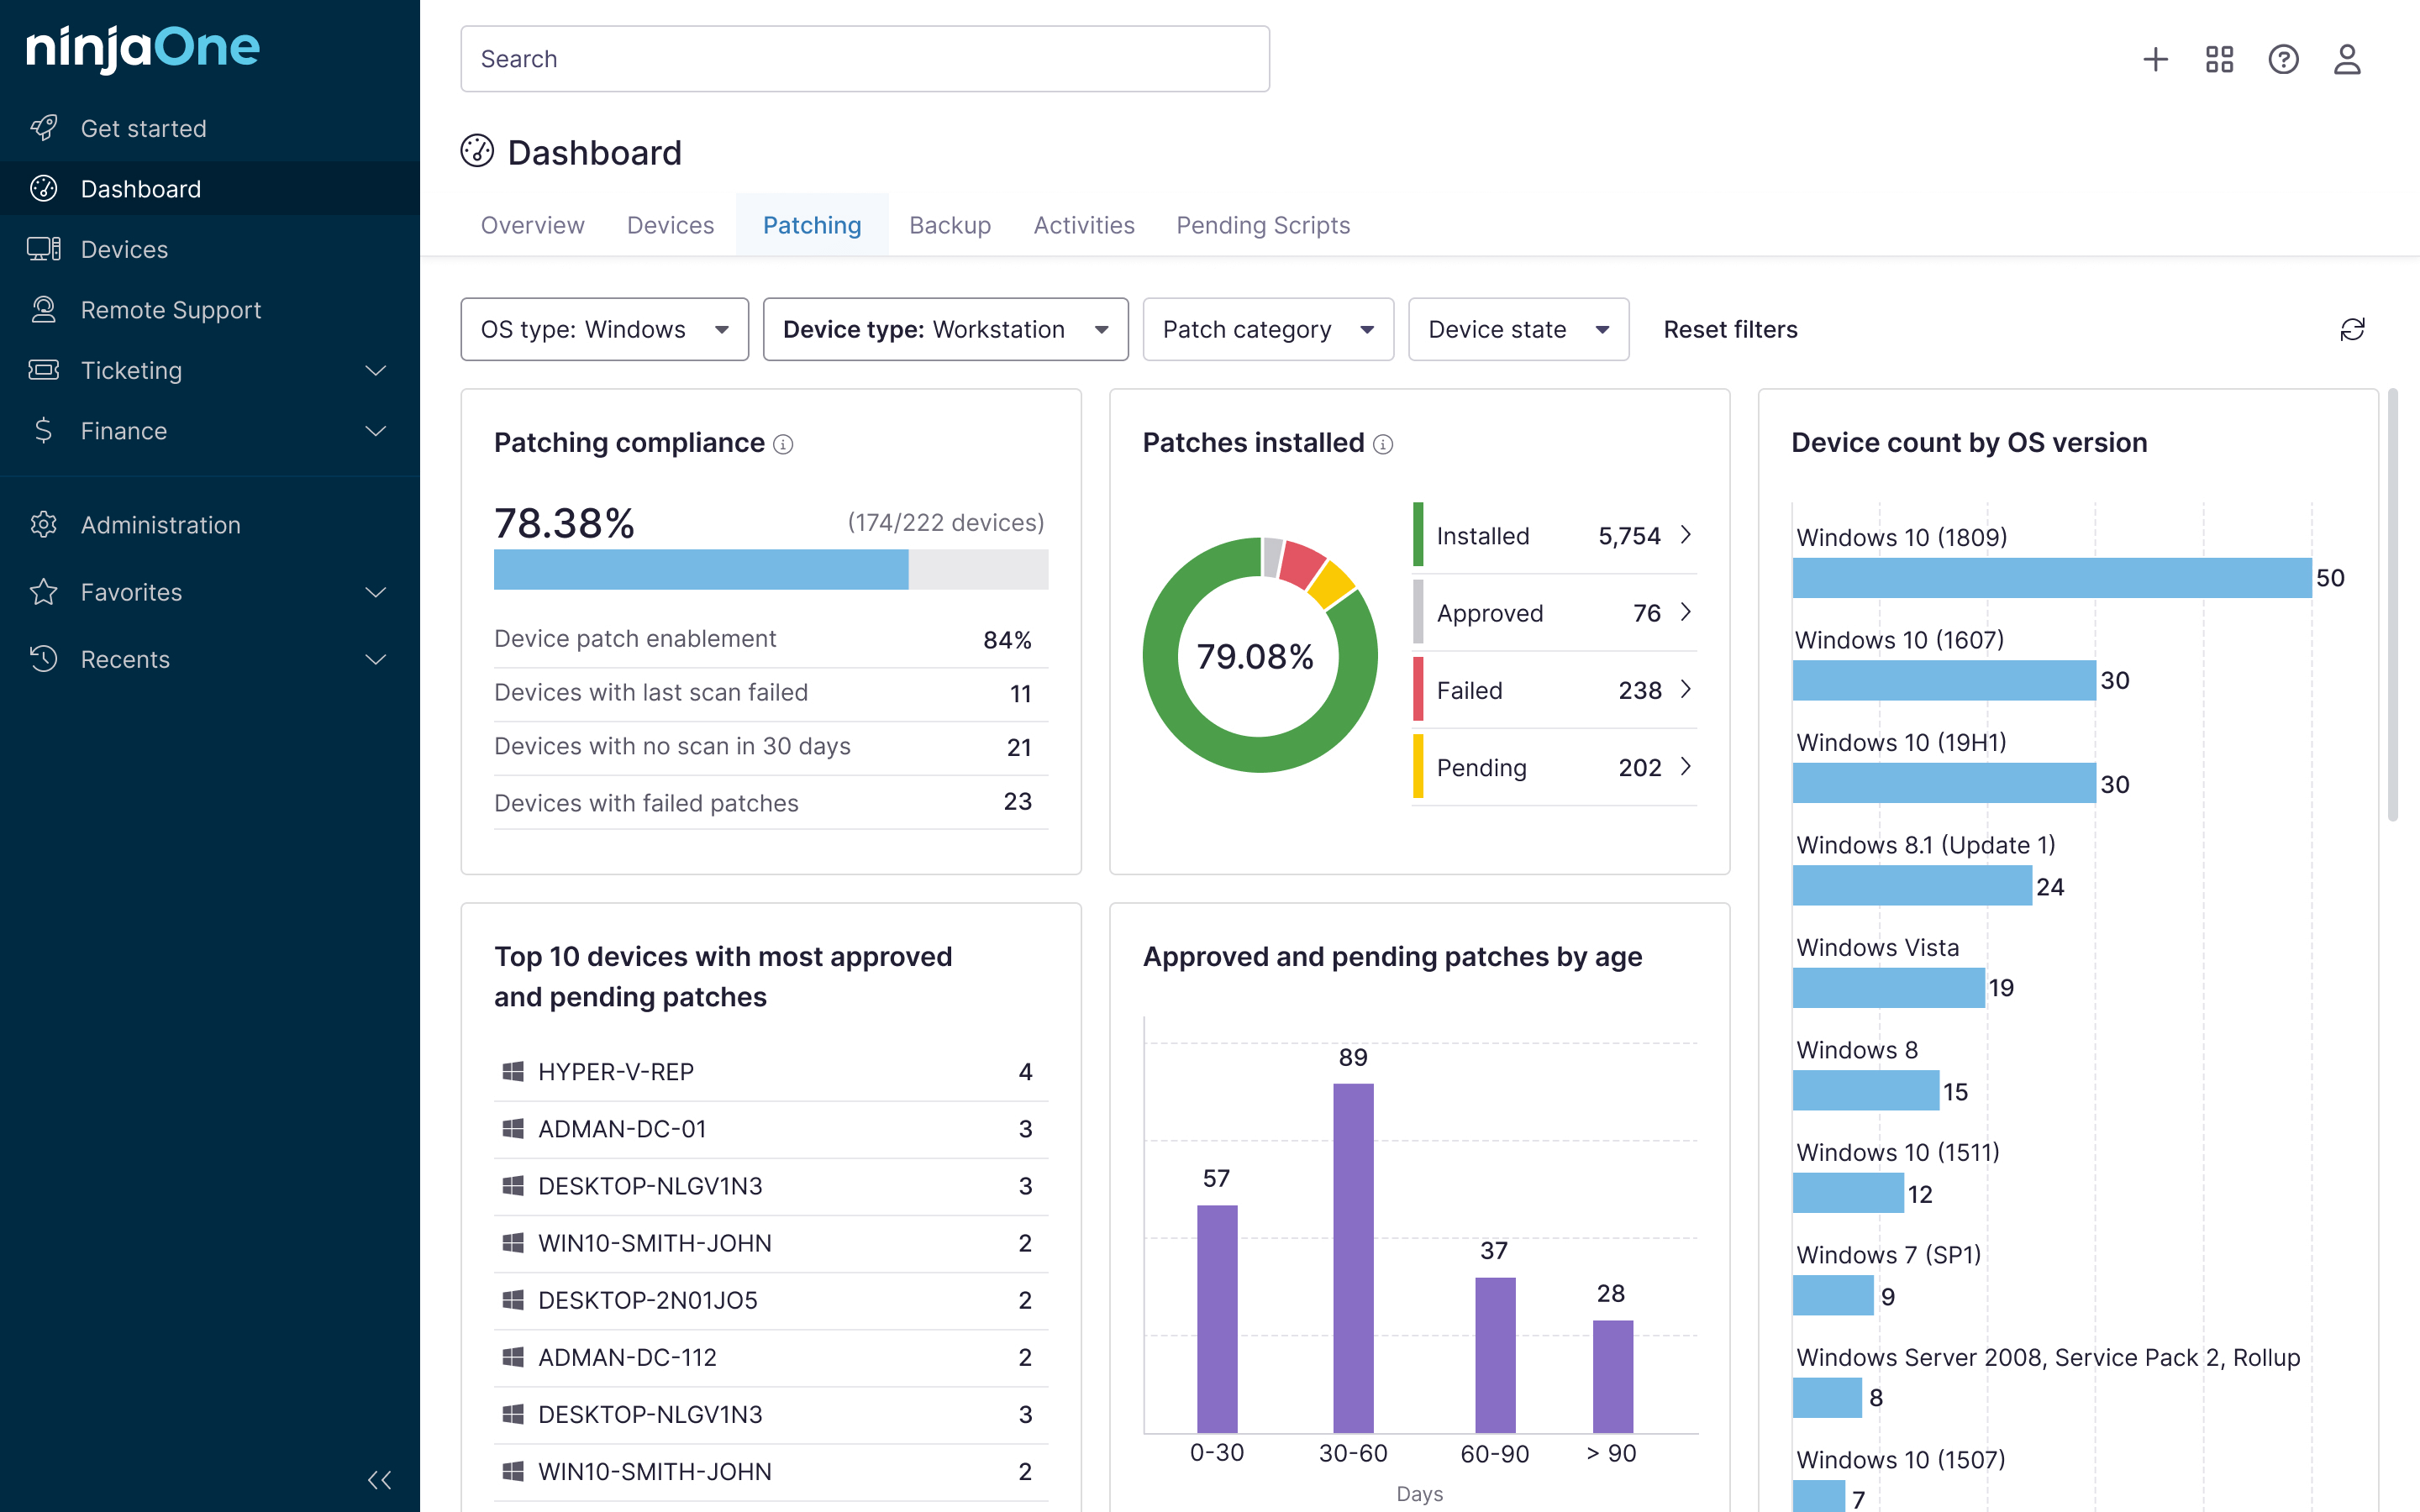
- Centralized dashboards: Display Defender alert status, escalation results, and affected endpoints across tenants.
Eliminate manual alert monitoring by automating alert escalation
Automating alert escalation from Defender to PSA platforms is essential for MSPs needing to operationalize detection and response workflows. Automation matters because it also eliminates manual alert monitoring overhead and ensures documented escalation with service-level tracking.
Related topics:


