Topic
This article explains how to interact with the Overview tab on the Finance Dashboard in NinjaOne.
Environment
NinjaOne Billing
Description
Once enabled, the NinjaOne Billing tool provides a Finance Dashboard in the left navigation pane, where you can create and manage agreements, view invoices, and recalculate prices on time entries. You can also perform these actions from the Finance tab on the Organization Dashboard. To enable this feature, refer to NinjaOne Billing: Getting Started with Professional Services Automation (PSA).
We have introduced profitability dashboards for NinjaOne Billing. The global level provides an overview of your business, showing invoices raised, time tracked, total invoiced, estimated total costs, and estimated profit. We also provide a global organization view, where this information is broken down by organization, allowing you to quickly identify any issues. Finally, at the global level, we provide a report that details products, allowing you to quickly identify any that are not profitable for you. At the organizational level, we have also introduced new reports to provide you with profitability information by agreement, product, or a general overview of the organization.

Index
Select a category to learn more:
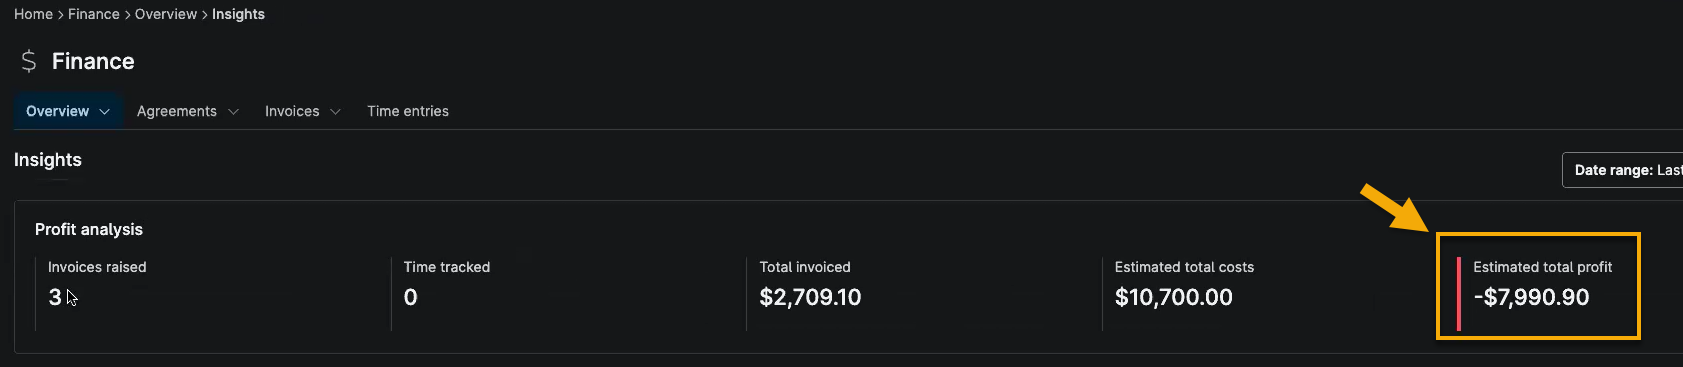
Insights
From the Finance Dashboard, click Overview and select Insights to view your profit analysis. This tab provides a profit summary for all organizations recorded in the division.
Use the Date range drop-down menu to adjust the data by time.
| Insight widget name | Description |
|---|---|
| Invoices raised | This indicates the sum of all invoices submitted. |
| Time tracked | This shows the total amount of time tracked in the selected period, regardless of whether it is invoiced. To learn more about time entries, refer to NinjaOne Billing: Time Entries. |
| Total invoiced | This indicates the amount billed across all invoices submitted. |
| Estimated total costs | This indicates an estimated cost for the selected products, based on the cost of items that have been invoiced in the selected period, and the estimated costs of time tracked by technicians in the period. The data is estimated as the technician hourly cost is used to estimate the cost of services you have provided, based on the amount of time they have tracked in the selected period. |
| Estimated total profit | This is calculated from the total invoiced in the selected period minus the estimated costs for that period. |

A red horizontal line at the beginning of the data widget will indicate a loss in profit.
Organizations
From the Finance Dashboard, click Overview and select Organizations to view your organization analysis. The organizations listed on this page are dependent on the access they have to organizations defined in their account permissions.

Use the Date range drop-down menu to adjust the data by time. Text that is highlighted in red font indicates a loss. Click the column headers to sort the data in ascending or descending order.
All available columns are displayed by default. You can use the table settings (represented by a gear icon) to hide or rearrange the columns.
Click the organization name to navigate to the Organization Dashboard → Finance → Overview → Insights page. From the Organization Dashboard Finance tab, you can access agreement, invoice, and time entry data specific to that organization.

Products
From the Finance Dashboard, click Overview and select Products to view the type, quantity, and profit of your billed products.
Use the Date range drop-down menu to adjust the data by time. Text highlighted in red indicates a loss.

All available columns are displayed by default. You can use the table settings (represented by a gear icon) to hide or rearrange the columns.
Click the product name to edit it. To learn how to create new products for billing, refer to NinjaOne Billing: Products.
Additional Resources
Refer to NinjaOne Billing: Resource Catalog to view all related articles.